
How Bear Markets Have Typically Ended
Bear markets rarely end when the news turns good. History shows bottoms often form as expectations, liquidity and policy stop getting worse.
Bear markets have usually ended before the economic news looked comfortable. A durable bottom tends to form when the market has already repriced a large part of the bad outcome, forced selling begins to fade, and investors see a credible path toward easier financial conditions, better earnings or less severe economic damage than previously feared.
A bear-market bottom is only obvious after it has happened
A common definition marks a bear market as a decline of at least 20% from a prior peak. That threshold is useful for labeling history, but it does not ring a bell at the bottom.
The S&P 500 has experienced repeated bear markets across very different environments: inflation shocks, recessions, financial crises, valuation collapses and sudden external shocks. S&P Dow Jones Indices notes that, over the live history of the S&P 500 through June 2025, bear markets averaged roughly a one-third peak-to-trough decline. The paths were anything but average.
The practical problem is that the ingredients that end a bear market often appear while the headlines still look bad. Markets price expected future cash flows and discount rates, not the current mood.
1974: the selling ended before inflation had been solved
The 1973–1974 decline combined an oil shock, high inflation, recession and a severe loss of confidence. By the time equities reached their low in 1974, the macro environment was still difficult.
The lesson from that episode is not that inflation stops mattering at a market bottom. It is that prices can fall far enough that the next change in expectations matters more than the level of the problem. Once investors no longer need to price an ever-worsening inflation and recession scenario, the market can turn even though the underlying economy remains weak.
That pattern appears repeatedly: a bottom is often about the rate of deterioration changing, not about conditions becoming good.
1982: policy credibility changed the discount-rate story
The early-1980s bear market sat inside a period of restrictive monetary policy and recession. The Federal Reserve had pushed rates high to break inflation, and the US economy entered a recession that the NBER dates from July 1981 to November 1982.
Stocks turned before the recession officially ended.
That matters because equity prices respond to the expected path of policy, inflation and profits. Once investors could plausibly see that the inflation fight was gaining credibility and that the next large move in rates would eventually be lower rather than higher, the valuation pressure began to change.
A recession can still be underway while the market starts trading the recovery.
2002: a valuation collapse needed time, not one dramatic policy event
The dot-com bear market was different. The problem was not primarily an oil shock or a banking system on the edge of failure. It was a huge revaluation of technology and growth expectations after the late-1990s boom.
S&P Dow Jones Indices dates the dot-com crash from September 2000 to October 2002 in one of its long-run market-period studies, with the S&P 500 losing almost half its value over that span.
The market did not bottom because one data release fixed the technology sector. Valuations compressed, unprofitable business models disappeared, corporate expectations reset and investors gradually became willing to pay for future earnings again.
Bear markets driven by valuation excess can end through time and repricing, not only through emergency intervention.
2009: financial-system stabilization mattered more than the recession date
The global financial crisis created the opposite problem: the market was questioning the solvency and functioning of the financial system itself.
The S&P 500 reached its crisis low in March 2009. The NBER later dated the recession trough to June 2009. In other words, the equity market turned months before the business cycle did.
By then, policy makers had already introduced extraordinary liquidity facilities, bank support and monetary easing. Investors did not need proof that unemployment had peaked or GDP had recovered. They needed enough evidence that the probability of an uncontrolled financial collapse had fallen.
The key transition was from systemic uncertainty toward a market that could once again put numbers around losses, capital needs and future earnings.
2020: the fastest bear market produced one of the fastest turns
The COVID-19 selloff compressed a normal bear-market sequence into weeks.
S&P Dow Jones Indices measures the S&P 500 decline from February 19 to March 23, 2020 at roughly 34%. The NBER dates the recession from February to April 2020, making it unusually short but exceptionally deep.
The market bottomed while infections were still rising, economic restrictions were expanding and earnings forecasts were being cut. What changed first was policy and liquidity. The Federal Reserve and US government moved rapidly to support financial markets, household income and credit.
The market did not wait for the economy to reopen. It reacted to a change in the distribution of possible outcomes.
2022: inflation and rates, not recession, were the central problem
The 2022 bear market is useful because it did not require an NBER recession.
Stocks fell as inflation stayed high, the Federal Reserve tightened aggressively and long-duration assets repriced to much higher discount rates. The eventual low came as investors began to see a possible path in which inflation could cool without an ever-rising terminal policy rate.
That episode is a reminder that “bear market” and “recession” are not synonyms. The trigger can be valuation, rates, liquidity or an earnings shock even when the broader economy avoids a formal contraction.
What the endings have in common
The history is messy, but several recurring conditions show up around major bottoms.
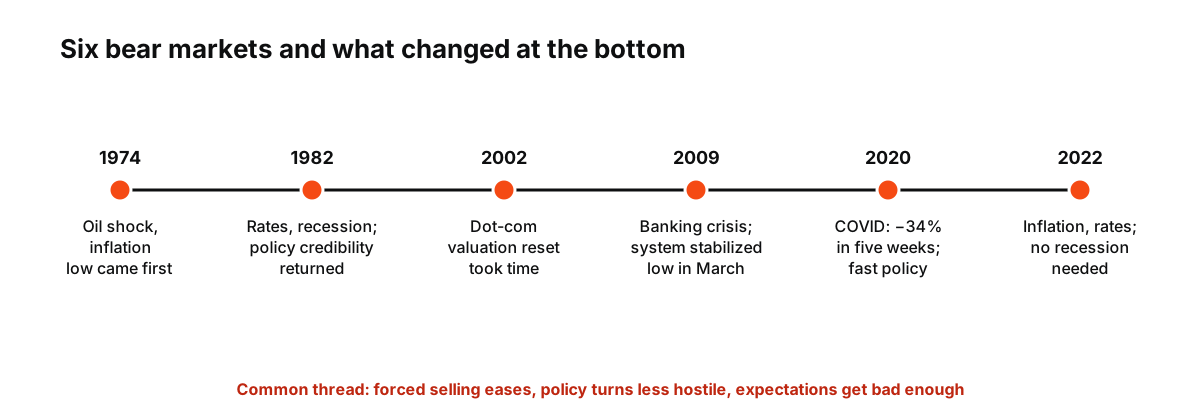
Figure: Six bear-market endings from this article. In 2009 and 2020 the market turned before the recession ended.
Forced selling becomes less important
During the worst phase of a decline, investors may sell because they have to: margin calls, redemptions, risk limits or liquidity needs. A market can stabilize once that mechanical pressure fades, even if discretionary buyers are still cautious.
The policy path becomes less hostile
Markets do not need rate cuts in every case. They need a credible change in the direction of financial conditions. That can mean lower expected rates, emergency liquidity, fiscal support or simply an end to increasingly restrictive policy.
Expectations become bad enough
A stock price can rise with weak earnings if the earnings are less weak than the market had priced. Bear markets often end when expectations become easier to beat.
The leadership changes before the index looks healthy
New bull markets rarely look identical to the old one. Leadership can broaden, defensive sectors can stop outperforming, credit spreads can improve, or beaten-down cyclicals can stabilize.
Those changes are more informative than a single dramatic up day.
What does not reliably identify the bottom
No indicator has ended every bear market.
A low price-to-earnings ratio can become lower. A volatility spike can be followed by another volatility spike. The first rate cut can arrive before more weakness. A 20% rebound can happen inside a longer decline.
Even recession dates are poor real-time trading signals because the NBER identifies turning points retrospectively. By the time a recession or recovery is formally dated, markets may have moved substantially.
The recurring pattern is a change in expectations
Bear markets have ended for different reasons, but the common thread is that prices stop needing a worse future.
Sometimes policy changes that future. Sometimes valuations fall far enough. Sometimes liquidity returns. Sometimes the feared recession is milder than expected. The bottom usually arrives before the evidence is complete.
That is why the clean historical chart and the real-time experience feel so different. History gives the turning point a date. Traders living through it only see a market arguing about whether the next piece of bad news is already in the price.