
Does the January Effect Still Exist?
The January Effect was strongest in small and beaten-down stocks, but later evidence is mixed. Learn why the anomaly may have weakened over time.
The January Effect is a historical pattern in which stocks, especially small companies and prior-year losers, produced unusually strong returns around the turn of the year. The effect was well documented in older data, but later research found it weaker and less stable. It remains a useful market-history lesson, not a reliable calendar trade.
The original anomaly was more specific than “stocks rise in January”
The popular version says January is a good month for stocks.
The academic version is narrower.
Research found that unusually strong January returns were concentrated in smaller companies and in stocks that had performed poorly before year-end. Richard Thaler’s 1987 review of the anomaly described small firms and prior losers as particularly important to the pattern.
That matters because a broad-market January rally is not the same thing as the classic January Effect.
The anomaly was about the cross-section of returns: which kinds of stocks performed unusually well, not simply whether the S&P 500 finished the month in green.
Tax-loss selling is one of the main explanations
A common explanation starts in December.
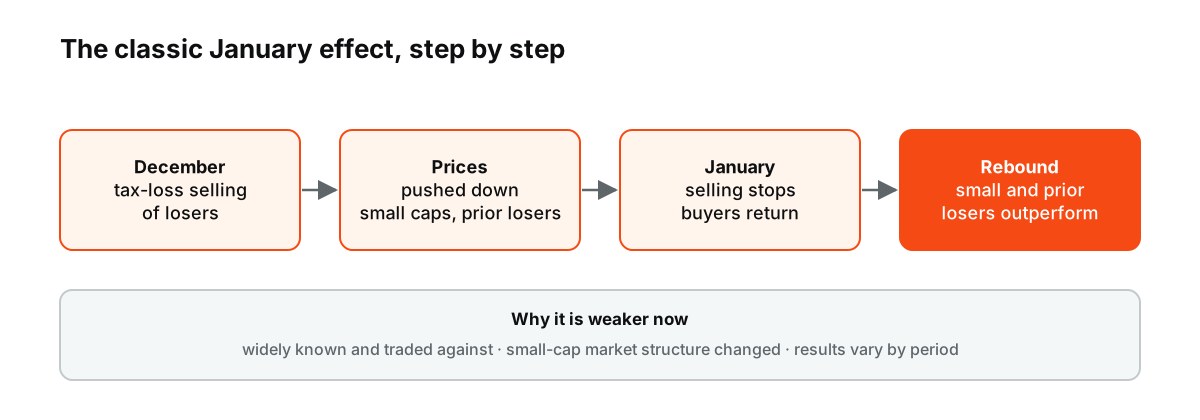
Figure: The classic explanation. The effect was always about small firms and prior losers, and its size has varied across periods.
Investors may sell losing positions before year-end to realize tax losses. That selling pressure can push already weak stocks lower, particularly in smaller and less liquid companies.
Once the calendar turns, the tax-motivated pressure disappears. Investors may repurchase positions or new buyers may step in.
The result can be a January rebound.
This explanation is appealing because it provides a mechanism rather than a coincidence.
It is not complete. Tax systems differ across countries, institutional investors face different constraints, and the effect has appeared in settings where tax-loss selling alone does not explain everything.
Window dressing may add another year-end distortion
Professional portfolio managers also report holdings to clients and regulators.
A manager may be reluctant to show a portfolio full of the year’s most embarrassing losers. Selling those names before a reporting date and rebuilding positions afterward can create another source of temporary pressure.
Again, the mechanism should be strongest in less liquid securities where moderate order flow has a larger price impact.
That fits the historical concentration of the January Effect in small stocks.
But it is difficult to measure window dressing directly, which leaves the explanation suggestive rather than definitive.
The effect became famous enough to attack itself
A market anomaly has a strange life cycle.
First, researchers document it. Then investors learn about it. Then capital tries to exploit it. If the anomaly is easy to trade, prices can adjust earlier and the edge can shrink.
That is one reason later studies ask whether the January Effect survived its own publicity.
A 2009 study examining the small-firm/January effect found that January returns had changed across subperiods and investigated whether learning and arbitrage had weakened the anomaly. The results did not support a simple story in which the effect vanished completely, but they did show that its magnitude was not stable.
The rule became harder to summarize than the headline.
Small-cap market structure has changed
Today’s small-cap market is not the small-cap market of the 1970s.
Institutional ownership is different. Index funds and ETFs create new trading flows. Electronic execution has reduced some frictions. Information travels faster. Tax-aware portfolio tools are more widely available.
All of those changes can reduce the temporary mispricings that helped create calendar anomalies.
At the same time, small stocks can still be less liquid and more sensitive to flows than mega-cap companies.
The mechanism has weakened without disappearing from the list of things worth measuring.
January can be positive for completely unrelated reasons
Suppose the Federal Reserve turns more dovish in December, bond yields fall and investors enter January expecting stronger growth.
Stocks may rally.
Calling that the January Effect confuses a macro move with a seasonal anomaly.
The same problem appears in reverse. A January selloff caused by a recession scare does not prove the historical effect never existed.
Calendar patterns are small effects sitting underneath much larger forces.
A clean analysis has to control for those forces rather than treating every January return as evidence for or against the anomaly.
“It worked this year” is a weak test
Ten or twenty trading days tell you very little about a phenomenon studied over decades.
A proper test asks:
- Is the average return difference statistically meaningful?
- Is it concentrated in small firms and prior losers?
- Does it survive after transaction costs?
- Does it persist outside the original sample?
- Is the result still present after controlling for other calendar effects?
- Has the magnitude weakened since publication?
Those questions are less exciting than checking whether the index rose in the first week of January. They are much closer to what the anomaly actually claims.
A simple illustration shows why averages can mislead
Imagine ten January periods with the following simplified small-stock returns:
+8%, -3%, +7%, +2%, +9%, -5%, +6%, +1%, -2%, +7%
The average is positive and looks impressive.
But three Januaries are negative, and the result may be driven by a few unusually strong years. If trading costs, volatility and the return available from a broad index are ignored, the apparent edge can look more useful than it was.
Seasonality is a distribution, not a coupon payment.
The January Effect is now more useful as a diagnostic
The best use of the anomaly is not to assume January must be strong.
It is to look for the mechanisms the research highlighted:
- year-end tax selling;
- unusual weakness in small prior-year losers;
- thin liquidity;
- sharp reversals in the first trading weeks;
- changes in small-cap relative strength.
If those conditions are absent, the historical label has less reason to matter.
If they are present, the pattern can help frame the flow dynamics without pretending the calendar causes the move.
The anomaly survived in textbooks better than in simple trading rules
The January Effect remains important because it helped challenge the idea that easily observed return patterns should not exist in efficient markets.
It also shows what often happens after an anomaly becomes famous: the effect changes, the market changes, and the original one-line rule becomes less dependable.
So, does the January Effect still exist?
Parts of the underlying seasonal behavior can still appear, particularly in smaller and beaten-down stocks. The evidence is too unstable to treat January itself as an automatic signal. The anomaly is more convincing as market history than as a calendar command.
Small caps and the Russell 2000
Because the original January effect was strongest in small companies, investors often look for it in small-cap indices such as the Russell 2000. In some years, small caps have outperformed large caps in early January, consistent with the return of buying after year-end tax-loss selling. In many recent years, the pattern has been weak or absent, and small-cap performance has depended far more on interest rates and the economy. See Russell 2000 vs S&P 500.
The year-end rally
The January effect is often discussed alongside the Santa Claus rally, a tendency for shares to rise in the last trading days of December and the first days of January. Holiday trading volumes are thin, which can exaggerate moves in either direction. Like the January effect, the year-end rally appears in long averages but is unreliable in any single year.
Outside the United States
Researchers have found January patterns in other markets too, but their strength varies with local tax years and market structure. In countries whose tax year does not end in December, any tax-related selling pressure falls at other times. That variation supports the idea that tax rules play a part in the effect where it exists.
For CFD traders
For anyone trading index or share CFDs, a seasonal tendency of this kind is too weak and inconsistent to justify a position on its own. Thin holiday liquidity, wider spreads and the risk of gaps after the new year matter more in practice. Seasonal patterns can be part of the background, alongside interest rates, earnings and valuations. See how stock index CFDs work and what moves stock market indices.
Common misreadings
- Treating one strong January as proof the effect is back.
- Assuming the effect applies to large companies.
January as a barometer
A related saying holds that as goes January, so goes the year: a rising January signals a good year and a falling one a weak year. The idea draws attention because January returns and full-year returns often share the same direction, but that is partly because the market rises in most years anyway, and January is part of the year being measured. Weak Januaries have been followed by strong years many times. The barometer is best treated as a curiosity rather than a forecast, since interest rates, earnings and the economy decide the year far more than its first month does. Treat it very lightly.
Frequently asked questions
Does the January effect still exist?
Studies suggest it has weakened considerably since it became widely known, especially in larger companies.
What causes it?
Year-end tax-loss selling and fund window dressing are the most common explanations, with buying returning in January.
This article is educational content and does not constitute financial, investment, legal or tax advice. Digital assets are volatile and you may lose the amount you invest.