
How Stock Index CFDs Work
An index CFD tracks an index such as the S&P 500 or DAX in points. How long and short index CFDs work, value per point, margin limits, financing and risks.
Index CFDs track a stock market index, such as the S&P 500, DAX or FTSE 100, letting you trade the whole market’s direction in one position. Prices move in points, and profit or loss is the point move times a value per point you choose. EU retail rules allow up to 20:1 leverage on major indices, a 5% margin.
Indices commonly offered
| Underlying index | Market | What it covers |
|---|---|---|
| S&P 500 | United States | About 500 large US companies |
| Nasdaq 100 | United States | 100 large non-financial Nasdaq companies, technology-heavy |
| Dow Jones Industrial Average | United States | 30 large US companies, price-weighted |
| DAX | Germany | 40 large German companies |
| FTSE 100 | United Kingdom | 100 large UK-listed companies |
| Euro Stoxx 50 | Eurozone | 50 large eurozone companies |
| Nikkei 225 | Japan | 225 large Japanese companies, price-weighted |
| Hang Seng | Hong Kong | Large Hong Kong-listed companies |
Providers often give their CFDs their own names, such as US 500 or Germany 40, because index names are trademarks, but the prices follow the underlying index or its futures.
Why trade an index instead of shares
An index CFD expresses a view on a whole market or region in a single position. It spreads company-specific risk across many shares, so one company’s bad results matter less, and it usually has tighter spreads, longer trading hours and higher permitted leverage than single shares. It suits traders whose view is about the economy, interest rates or market sentiment rather than one company. It can also hedge a portfolio of shares against a broad market fall.
How an index CFD trade works
- Choose an index and direction.
- Choose size as a value per point, for example $1 per point (example value).
- Post margin: position value = index level × value per point; margin at 20:1 is 5% of that.
- Close to realize points gained or lost × value per point.
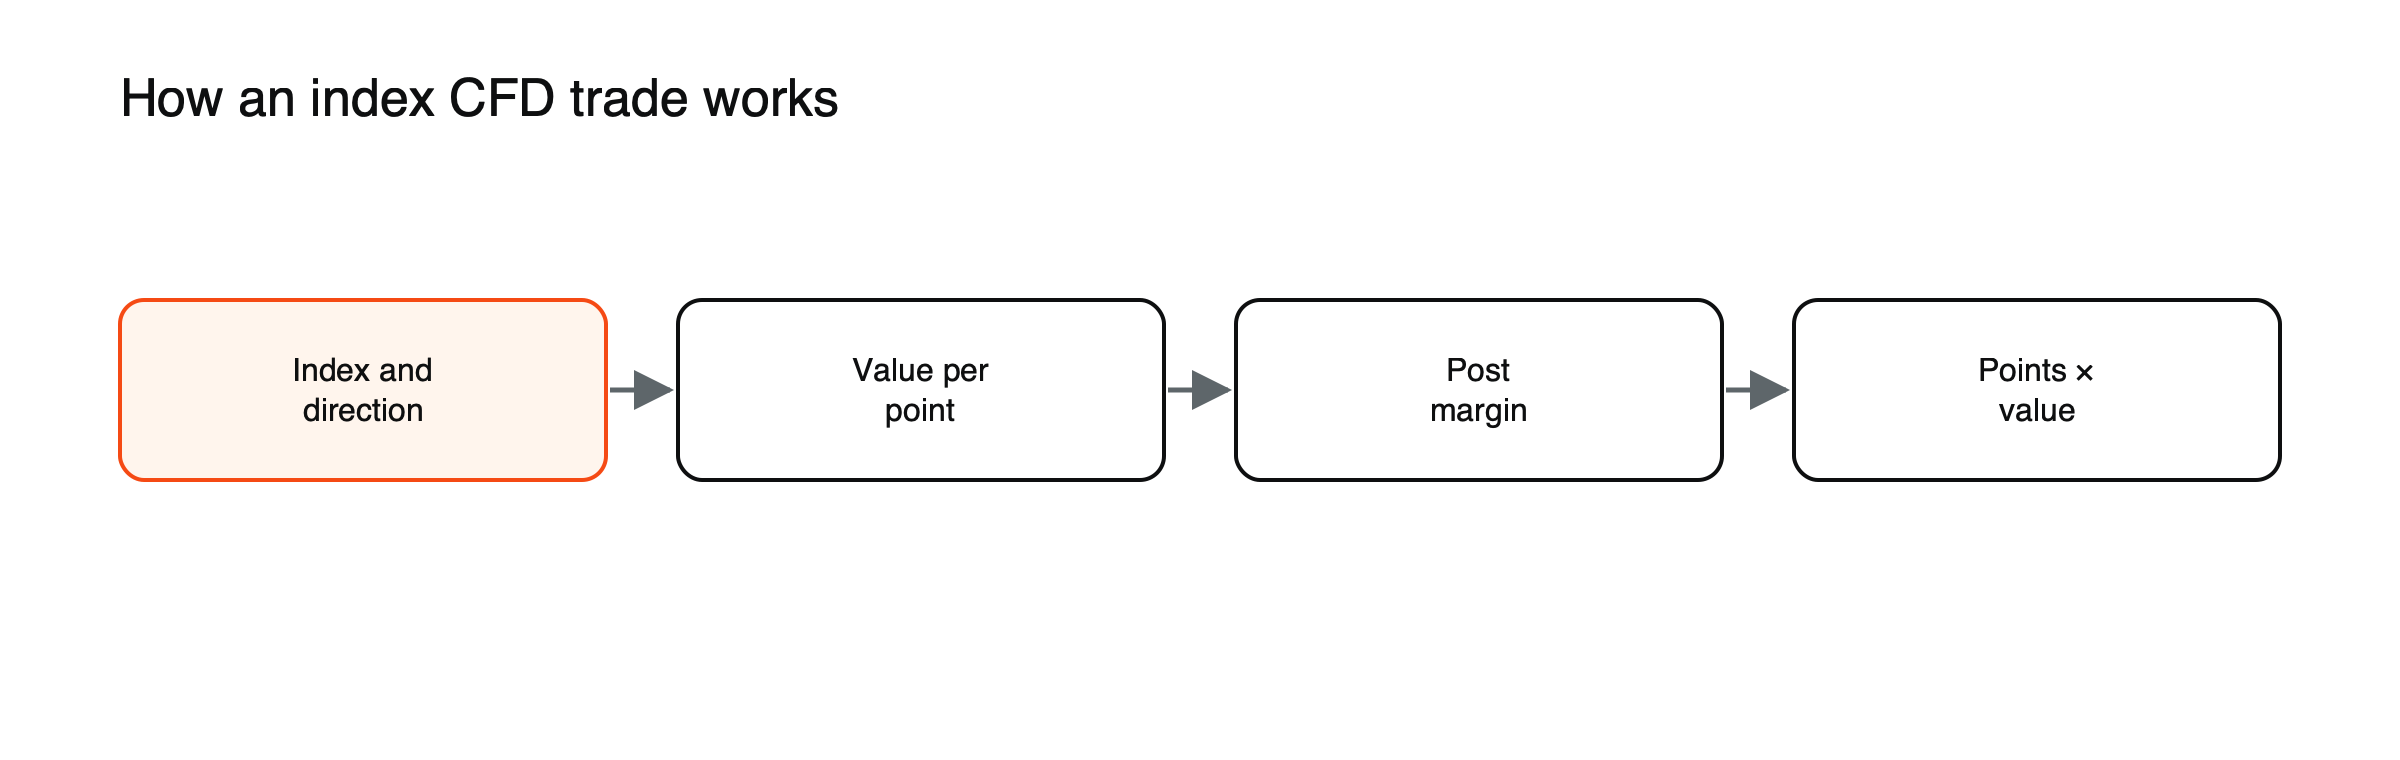
Figure: An index CFD trade, step by step.
Example: buy at 5,000 with $2 per point: position value $10,000; margin at 20:1 is $500. A 50-point rise earns $100. See how to calculate the value of a point.
A full trade, worked through
A trader buys a cash US 500 CFD at 5,000 with $2 per point, a $10,000 position, paying a spread of about 0.5 points, or $1. Margin at 20:1 is $500. The position is held for five nights; with a benchmark rate of 4.3% plus an illustrative 2.5% markup, financing is about $9.32. The index rises to 5,080, and the trader closes for a gross gain of $160. After the spread and financing, the net result is about $150, 30% of the margin. Had the index fallen 80 points instead, the loss would have been about $170 after costs. (Illustrative figures.)
Hedging with an index short
An investor holding a $20,000 portfolio of shares with an average beta of 1.1 can hedge most of its market risk by shorting about $22,000 of the index. With the index at 5,000, that is about $4.40 per point. If the market falls 5%, the portfolio might lose about $1,100 while the short gains about $1,100, leaving mainly the effect of how the chosen shares perform relative to the market. See how stock beta is calculated.
Cash vs futures-based index CFDs
Cash index CFDs track the current level and incur daily financing; futures-based ones track an index future with an expiry. See how CFD prices track the underlying market.
Dividends
When index members pay dividends, cash index CFDs get adjustments. See how index dividends are adjusted.
Trading hours
Many index CFDs trade almost around the clock on weekdays, with prices outside the underlying exchange’s hours derived from index futures, which trade nearly continuously. That lets traders react to overnight news, but liquidity is thinner and spreads wider outside the main session. Some providers offer weekend prices on major indices, based on their own estimates, which can differ sharply from where markets reopen. See how to plan index trades around market opens.
What moves indices
Indices respond to the forces that move whole markets: interest rates, economic data, earnings season, central bank decisions, currency moves and risk sentiment. The largest companies in an index can move it on their own results. Volatility indices such as the VIX, which measures expected volatility in the S&P 500, show how nervous the market is and tend to rise when indices fall. See what moves stock market indices.
Key risks
- Gaps at the open after overnight news. See how to plan index trades around market opens.
- Leverage: a 5% fall wipes out 20:1 margin.
- Concentration: a few large stocks can drive the index.
See what a CFD is and what moves stock market indices.
Margin and stop-out, worked through
Suppose an account holds $1,000 and opens the $10,000 US 500 position above, using $500 of margin. Under EU retail rules, positions are closed when equity falls to half the margin required, here $250. That would take a loss of $750, or 375 points at $2 per point, a fall of about 7.5% from 5,000. Indices have fallen that much in a few days during sell-offs, so this account is far more exposed than its single position suggests. A smaller value per point leaves more room. See what margin calls and stop-outs are.
Concentration inside indices
Many indices are weighted by company size, so a handful of very large companies can account for a big share of their moves. In the S&P 500 and Nasdaq 100, a few technology giants carry heavy weights; in the FTSE 100, energy, mining and banking companies matter more. An index position is therefore not as diversified as the number of companies suggests. See why a handful of stocks can drive an entire index.
Currency and index levels
Each index is priced in its home currency: US indices in dollars, the DAX and Euro Stoxx 50 in euros, the FTSE 100 in pounds. For an account in another currency, results include currency moves. The FTSE 100, which contains many companies earning abroad, often rises when the pound falls, which partly offsets the currency effect for foreign investors. See why the FTSE 100 often moves against the pound.
A checklist before an index trade
- Is the CFD cash or futures-based, and what does holding it cost?
- What is the value per point, and how far is the stop in points and money?
- Which economic releases, central bank decisions or big earnings are due?
- Are there large dividend adjustments coming?
- How would a 5% to 10% move affect the account?
Futures-based index CFDs, worked through
A futures-based index CFD follows a futures contract, whose price includes the cost of carrying the index until expiry: interest on the money tied up, minus the dividends the index members are expected to pay. With an index at 5,000, interest at 4.3% and dividends of 1.3% a year, a three-month future would trade near 5,000 × (1 + 3% × 0.25), about 5,037.5. (Illustrative figures.) Holding the futures-based CFD involves no daily financing, but the higher entry price builds the carry in, and positions roll at expiry. See index futures vs index CFDs.
Choosing between cash and futures-based CFDs
Cash index CFDs usually have tighter spreads and suit trades lasting hours or days, with financing charged nightly. Futures-based CFDs often have wider spreads but no nightly financing, which can make them cheaper for positions held for weeks or months. Comparing the expected financing on a cash CFD with the spread and carry on a futures-based one, for the planned holding period, shows which is cheaper.
Index CFDs, futures and funds compared
| Index CFD | Index future | Index fund | |
|---|---|---|---|
| Leverage | Up to 20:1 retail on major indices | Built in via exchange margin | None unless borrowed |
| Size flexibility | Small fractions per point | Fixed contract sizes, often large | Any amount |
| Holding costs | Financing or roll carry | Roll carry | Annual fund fee |
| Short selling | Straightforward | Straightforward | Usually not possible |
Earnings season and indices
During reporting season, results from the largest companies move indices on their own, and peer read-across can lift or sink whole sectors. Index traders often watch the reporting calendar of the top ten members as closely as economic data.
Common mistakes
The most frequent are using maximum leverage, forgetting financing on positions held for weeks, holding through major central bank decisions at full size and treating an index as fully diversified when a few stocks dominate it. See mistakes traders make with index CFDs.
Choosing an index to trade
Traders often pick indices that match the hours they trade and the news they follow. European traders active in the morning may focus on the DAX or FTSE 100; those trading in the US afternoon may prefer the S&P 500 or Nasdaq 100; traders in Asia may follow the Nikkei or Hang Seng. Each index also has a character: the Nasdaq 100 is more volatile and rate-sensitive, the FTSE 100 more tied to commodities and the pound, the DAX to global trade and industry.
Starting small
For newcomers, the flexibility of index CFDs is both an advantage and a risk. Small values per point allow modest positions, but the high leverage permitted makes it easy to take on far more exposure than intended. Starting with a value per point that limits the loss on a 2% adverse move to a small share of the account, and increasing only after gaining experience, is a sensible approach. Keeping a trading journal by index also shows which markets really suit your style and hours, and which consistently cost more than they earn, so that time and capital can be focused where results are strongest over time.
Frequently asked questions
Why is leverage on indices higher than on single shares?
Because broad indices are usually less volatile than individual shares, EU retail rules allow up to 20:1 on major indices, compared with 5:1 on single shares.
Can I hold an index CFD for months?
You can, but cash index CFDs incur daily financing, which adds up over long periods. Futures-based CFDs or unleveraged index funds may suit longer holds better.
Do index CFDs pay dividends?
Cash index CFDs receive dividend adjustments when index members go ex-dividend; shorts are debited. See how index dividends are adjusted.
Leverage, margin and cost figures in this article are example values for illustration. Actual terms depend on the provider, the instrument and the rules in your country.
This article is educational content and does not constitute financial, investment, legal or tax advice. Digital assets are volatile and you may lose the amount you invest.