
How to Read the Weekly EIA Oil Inventory Report
Compare crude stock changes with expectations, then read gasoline and distillate stocks, Cushing, refinery use and exports: reading the weekly EIA report.
To read the weekly EIA oil inventory report, compare the change in US commercial crude stocks with expectations, then check gasoline and distillate stocks, Cushing inventories, refinery use and exports. The Weekly Petroleum Status Report comes out after 10:30 a.m. Eastern, usually Wednesdays, and often moves oil within minutes.
Before you start
Note the consensus forecast for crude, gasoline and distillate changes, and any industry estimates released the day before.
Reading it, line by line
Crude stock change vs expectations
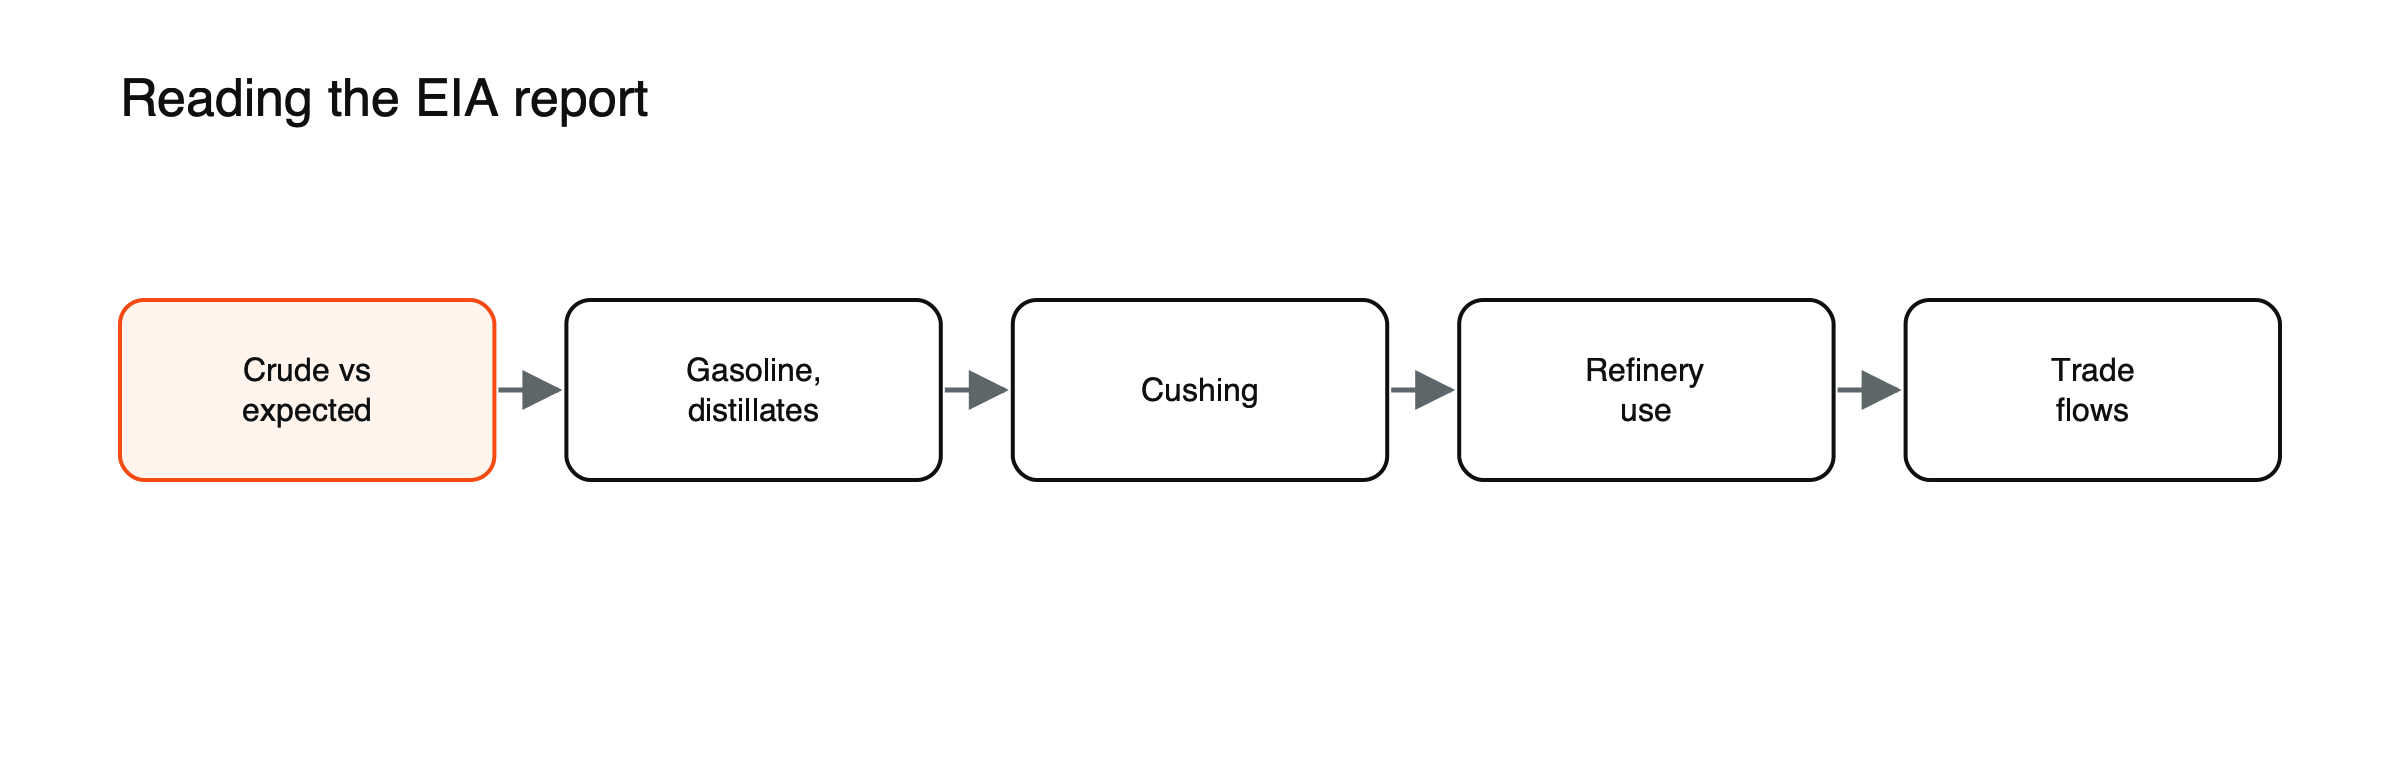
Figure: Reading the weekly report.
A bigger-than-expected build suggests weaker demand or ample supply; a bigger draw suggests tightness.
Gasoline and distillates
Product stocks show consumer and industrial demand, important in driving and heating seasons.
Cushing inventories
Stocks at the WTI delivery hub affect WTI and its spread to Brent. They fell below 20 million barrels in mid-2026. See WTI vs Brent.
Refinery utilization
High runs, such as 96.1% in June 2026, draw down crude and add products.
Production, imports and exports
Changes in trade flows can explain swings that are not about demand.
A report, worked through
Suppose analysts expect US commercial crude stocks to fall by 1.5 million barrels, and the report shows a rise of 3.2 million. (Illustrative figures.) At first glance, that is bearish, and oil may drop within seconds. But the same report shows gasoline stocks falling sharply, refinery use rising and exports up, with lower imports than usual. Reading those details, traders may decide the crude build came from timing of shipments rather than weak demand, and prices recover part of the fall within the hour. The headline moved the market first; the details decided where it settled.
The industry estimate the day before
An industry group, the American Petroleum Institute, publishes its own inventory estimate the afternoon before the official report. Markets often react to it, and the official figures are then judged partly against both the consensus and that estimate. When the two disagree, the official report can produce a larger move than usual.
Implied demand
The report includes figures for products supplied, a measure of how much gasoline, distillates and other products leave the system each week. It is often read as a proxy for demand. Weekly figures are noisy, so traders tend to look at four-week averages and compare them with the same period in previous years.
Common mistakes
- Reading one week in isolation; weekly data are noisy.
- Ignoring the Strategic Petroleum Reserve, reported separately.
- Trading the first spike, which often reverses.
See what moves crude oil prices, how to read an economic calendar and how commodity CFDs work.
When the report comes out
The Weekly Petroleum Status Report is normally released on Wednesday after 10:30 a.m. Eastern time, with schedules shifting around US holidays. The weekly natural gas storage report follows on Thursday morning. Adding both to your calendar alongside currency and central bank events avoids being surprised by moves in oil and related currencies such as the Canadian dollar. See how to read an economic calendar.
Seasonal patterns
Inventories follow seasonal rhythms. Refiners often run harder ahead of the summer driving season, drawing down crude and building gasoline, then switch toward heating oil and diesel ahead of winter. Maintenance periods in spring and autumn can lower refinery runs and lift crude stocks. Comparing each week with the same week in previous years, rather than with the week before, filters out much of this seasonal noise.
How long the reaction lasts
The first move after the release is often driven by the headline crude figure and can reverse once traders read the details. Lasting effects usually come from a run of reports pointing the same way, such as several weeks of unexpected draws suggesting a tightening market. A single report rarely changes the bigger picture on its own.
WTI, Brent and the report
Because the report describes the US market, it usually moves WTI, the US benchmark, more than Brent, the international one. A large draw at Cushing or strong exports can push WTI up relative to Brent, narrowing the gap between them; a build at Cushing can widen it. Traders who hold positions in one benchmark but follow news on the other should keep this difference in mind. See WTI vs Brent.
The Strategic Petroleum Reserve
The United States keeps an emergency stockpile of crude, the Strategic Petroleum Reserve, which is reported separately from commercial inventories. Large releases from the reserve, or purchases to refill it, change the total amount of oil available and can affect prices over months. A commercial build that coincides with oil moving out of the reserve tells a different story from one driven by weak demand.
A weekly routine for oil traders
On Tuesday, note the consensus forecasts and the industry estimate. On Wednesday, read the headline crude change, then gasoline, distillates, Cushing, refinery runs, exports and products supplied, in that order. Compare each with the same week last year. Record the price reaction after five minutes and after an hour. After a few months, the record shows which parts of the report your market reacts to most and how often the first move holds.
Trading around the release
Spreads on oil CFDs widen around 10:30 a.m. Eastern time on report days, and prices can move sharply in seconds. Traders who do not plan to trade the release often reduce positions or avoid entering in the minutes before and after. Those who do trade it usually wait for the details rather than reacting to the headline alone. See how to prepare for high-impact news.
Measures analysts calculate
Beyond the published lines, analysts often add crude and product stocks together to get total petroleum inventories, since a crude build can be offset by product draws. Others calculate days of supply, dividing stocks by recent daily demand, which allows fairer comparisons across seasons and years. These derived figures help separate a genuine change in the market’s balance from a shift between crude and products or a temporary change in trade flows. Tracking them alongside the headline lines takes little extra time once a spreadsheet is set up for the weekly figures each Wednesday.
Frequently asked questions
Why does Cushing matter so much?
Cushing, Oklahoma, is the delivery point for the main US crude futures contract, so stock levels there directly affect WTI prices and the spread between WTI and Brent.
Does the report matter for traders outside oil?
Yes, indirectly. Oil prices affect inflation expectations and currencies of oil exporters such as Canada and Norway, so big surprises can ripple into other markets.
This article is educational content and does not constitute financial, investment, legal or tax advice. Digital assets are volatile and you may lose the amount you invest.
Sources
- What’s new: release schedules (Weekly Petroleum Status Report after 10:30 a.m.; Weekly Natural Gas Storage Report Thursday 10:30 a.m.; Cushing stocks; refinery utilization) — US EIA
- U.S. commercial crude oil inventories have decreased in June (refineries at 96.1% utilization in the week ending June 19, 2026) — US EIA