
What Moves the 10-Year Treasury Yield?
The 10-year Treasury yield moves on expected Fed policy, inflation, growth, debt supply and the term premium. How each driver works, with 2013, 2022, 2026.
The 10-year Treasury yield moves on expected Fed policy, inflation expectations, growth, government debt supply and the term premium, the extra yield demanded for lending for a decade. It anchors mortgages, corporate borrowing and stock valuations. In 2022 it rose from about 1.5% to about 4.2%, and a sharp 2026 rise revived that memory.
Breaking the yield into parts, illustrated
One way to understand the 10-year yield is as the sum of two parts: the average short-term rate investors expect over the next ten years and the term premium for locking money up that long. If markets expect the Fed’s policy rate to average 3.5% and investors demand a term premium of 0.5 points, the 10-year yields about 4.0%. (Illustrative figures.) A shift in either part, through new expectations for policy or a change in the premium, moves the yield. Separating the two explains why yields can rise even when the Fed is cutting.
Fed policy expectations
The 10-year reflects the average expected policy rate over the decade. Signals about future hikes or cuts move it, as in the 2013 taper tantrum. See what the 2013 taper tantrum was.
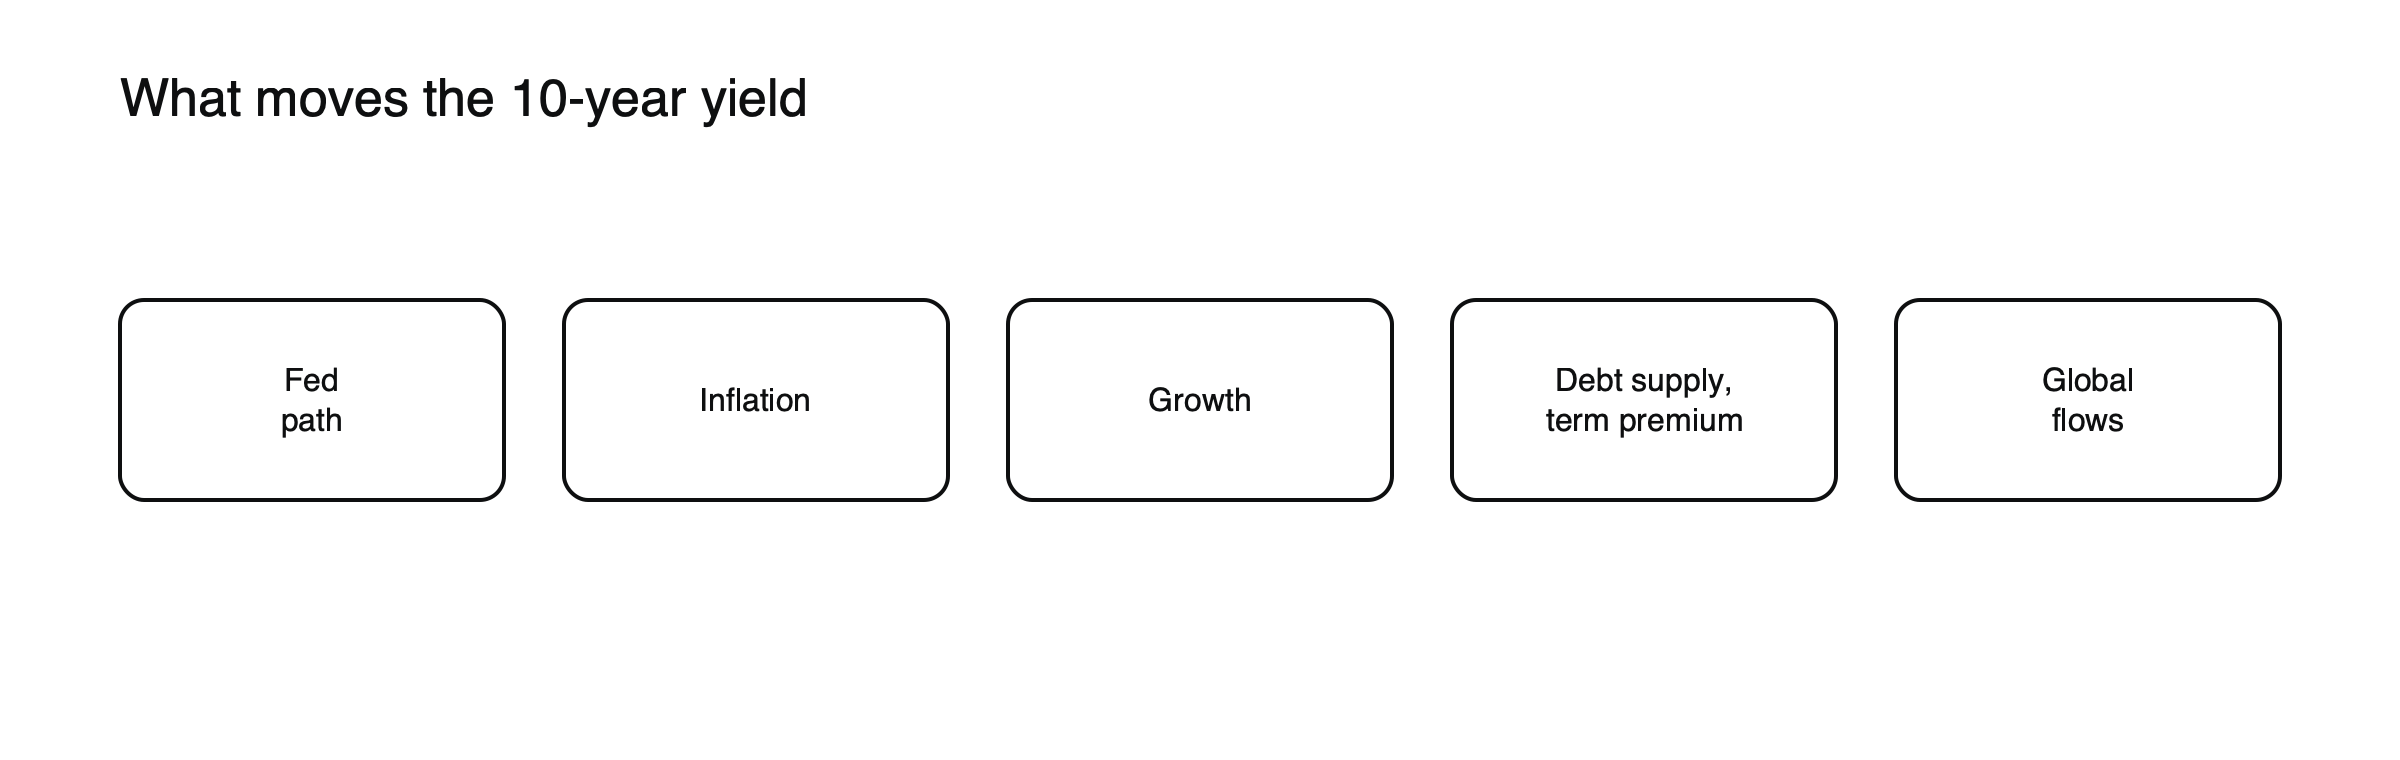
Figure: What moves the 10-year yield.
Inflation
Higher expected inflation raises yields through breakevens. See how to read breakeven inflation.
2022: the inflation shock
As inflation surged in 2022 and the Fed raised rates rapidly, the 10-year yield rose from about 1.5% to about 4.2%. Both parts rose: expected policy rates jumped, and the term premium increased as investors demanded more compensation for inflation uncertainty. The move caused the worst year for US bonds in decades and pressured share valuations, especially growth stocks.
Growth
Strong data raise yields; recession fears lower them.
Debt supply and the term premium
Large deficits and heavy Treasury issuance can raise the term premium. See how fiscal deficits affect markets.
Global flows
Foreign demand, including from Japan, and safe-haven buying in crises matter. See how Japan’s bond market affects global yields.
A data day, illustrated
Suppose US inflation for a month comes in at 0.5% against expectations of 0.3%. (Illustrative scenario.) Traders raise their expectations for future Fed rates, and the 10-year yield jumps perhaps 0.15 points within minutes. The dollar strengthens, gold and growth stocks fall and mortgage rates edge higher in the following days. A softer-than-expected report would trigger roughly the opposite moves. Major releases such as inflation, employment and retail sales regularly produce moves of this kind. See how to read an economic calendar.
Why traders watch it
It moves the dollar, gold, growth stocks and mortgage rates. See how interest rates affect stock prices, what the yield curve is and how bonds work.
Mortgages and borrowing costs
US 30-year mortgage rates are priced off longer Treasury yields, mainly the 10-year, plus a spread for lenders’ costs and risks. When the 10-year rises by a percentage point, mortgage rates usually rise by a similar amount over time, affecting home sales and prices. Corporate borrowing costs and many other loan rates follow the same benchmark.
Stock valuations
The 10-year yield is often used as the risk-free rate in valuing shares. Higher yields reduce the present value of future profits, weighing most on companies whose profits lie far in the future, such as fast-growing technology firms. That is why the Nasdaq 100 often falls more than broader indices when the 10-year jumps. See why tech stocks are so sensitive to bond yields.
The dollar and gold
Rising US yields tend to attract capital to dollar assets, strengthening the dollar, and raise the opportunity cost of holding gold, which pays no income. Falling yields often do the reverse. These links are not fixed, but they hold often enough that currency and commodity traders watch the 10-year closely.
Auctions and supply
The Treasury sells 10-year notes at regular auctions. Weak demand, seen in higher-than-expected auction yields, can push yields up across the market, especially when investors are already worried about large deficits and heavy issuance.
2026
In 2026, yields rose again in a rate shock, but because they started from much higher levels than in 2021, bondholders’ income cushioned losses far more than in 2022, according to Vanguard. Higher starting yields change how painful a given rise in yields is.
Trading the 10-year through CFDs
Traders who want exposure to the 10-year yield usually trade CFDs based on 10-year Treasury note futures. Because futures prices move inversely to yields, a trader expecting yields to rise sells. A 0.10-point move in yield moves the futures price by roughly 0.8% to 0.9%, reflecting the note’s duration. Position sizes should be set with that sensitivity in mind.
Global yields and the 10-year
The 10-year Treasury yield is linked to yields abroad. When yields rise in Germany or Japan, some investors who would have bought Treasuries stay at home, nudging US yields up. Changes in Japanese policy are watched especially closely, because Japanese investors are among the largest foreign holders of Treasuries. See how Japan’s bond market affects global yields.
Safe-haven flows, illustrated
Suppose a geopolitical shock hits markets overnight. (Illustrative scenario.) Investors sell shares and buy Treasuries, and the 10-year yield falls 0.20 points even though nothing has changed about inflation or Fed policy. If the shock fades, the move often reverses within days. In shocks that raise inflation, such as an energy price surge, yields can instead rise, as fears about inflation outweigh the search for safety.
The 10-year and the 2-year
The 2-year yield reacts mostly to expected Fed policy over the next two years, while the 10-year also reflects longer-run growth, inflation and the term premium. The gap between them, the 2s10s spread, shows whether the yield curve is steep, flat or inverted, which feeds into bank profits and recession signals. See what an inverted yield curve means.
Common misreadings
- Assuming the 10-year always falls when the Fed cuts.
- Treating every yield rise as an inflation signal.
The term premium swings
The term premium was unusually low, even negative, for much of the 2010s, as central bank bond buying and strong demand for safe assets held long yields down. It rose in 2022 and 2023 as inflation uncertainty grew and the Fed reduced its bond holdings. Swings in the term premium can move the 10-year yield by large amounts without any change in expected policy rates, which is why analysts estimate it separately.
The 2013 taper tantrum
In 2013, when the Fed signaled it might slow its bond purchases, the 10-year yield rose from about 2% in May to about 3% by December. Policy rates did not change; the move came from expectations and the term premium. The episode is a classic example of how communication alone can move long yields. See what the 2013 taper tantrum was.
Reading the 10-year with its components, illustrated
Suppose the 10-year yield rises 0.30 points in a month. (Illustrative scenario.) If 10-year TIPS yields rose 0.25 points and breakevens 0.05, the move mostly reflects tighter real financing conditions, often bad for gold and growth shares. If TIPS yields were flat and breakevens rose 0.30, the move reflects higher inflation expectations, which can support commodities. Splitting the move this way tells traders which story the bond market is telling. See how to read breakeven inflation.
A 10-year checklist
- What did the latest inflation and employment data show?
- How are Fed expectations shifting?
- Is the move coming from real yields or breakevens?
- Are global yields moving the same way?
Where to watch it
The 10-year yield is shown on most financial websites and trading platforms, updated throughout the day. Watching it alongside the 2-year yield, TIPS yields and the dollar gives a quick picture of what bond markets are pricing. Many traders keep all four on a screen.
Frequently asked questions
Why is the 10-year the benchmark?
It balances short-term policy and long-term growth expectations, is heavily traded and is used to price mortgages and many corporate loans.
Can the Fed control the 10-year yield?
Not directly. It sets short-term rates and can buy bonds, but the 10-year mainly reflects markets’ expectations and the term premium.
This article is educational content and does not constitute financial, investment, legal or tax advice. Digital assets are volatile and you may lose the amount you invest.
Sources
- Why ordinary investors got hit so hard in 2022 (10-year yield from about 1.5% to about 4.2%) — Yahoo Finance via AOL
- How 2026 may set the table for stronger bond returns (2026 rate shock; higher starting yields than in 2022) — Vanguard, September 2026
- No taper tantrum this time? (10-year yield from about 2% in May 2013 to about 3% in December) — FRED Blog, St. Louis Fed