
How to Read Breakeven Inflation From Bond Yields
Breakeven inflation = nominal Treasury yield − TIPS yield. With the 10-year at 4.20% and TIPS at 1.90%, markets imply about 2.3% inflation. How to read it.
Breakeven inflation is the inflation rate at which a regular Treasury and a TIPS of the same maturity earn the same: breakeven ≈ nominal yield − TIPS yield. With the 10-year at 4.20% and 10-year TIPS at 1.90%, it is about 2.30%, so the market prices roughly 2.3% average inflation over 10 years.
The formula
- Approximate: breakeven = nominal − real (TIPS)
- Exact: (1 + nominal) ÷ (1 + real) − 1
Worked example
- 10-year Treasury 4.20%; 10-year TIPS 1.90%
- Approximate breakeven: 2.30%
- Exact: 1.042 ÷ 1.019 − 1 ≈ 2.26%
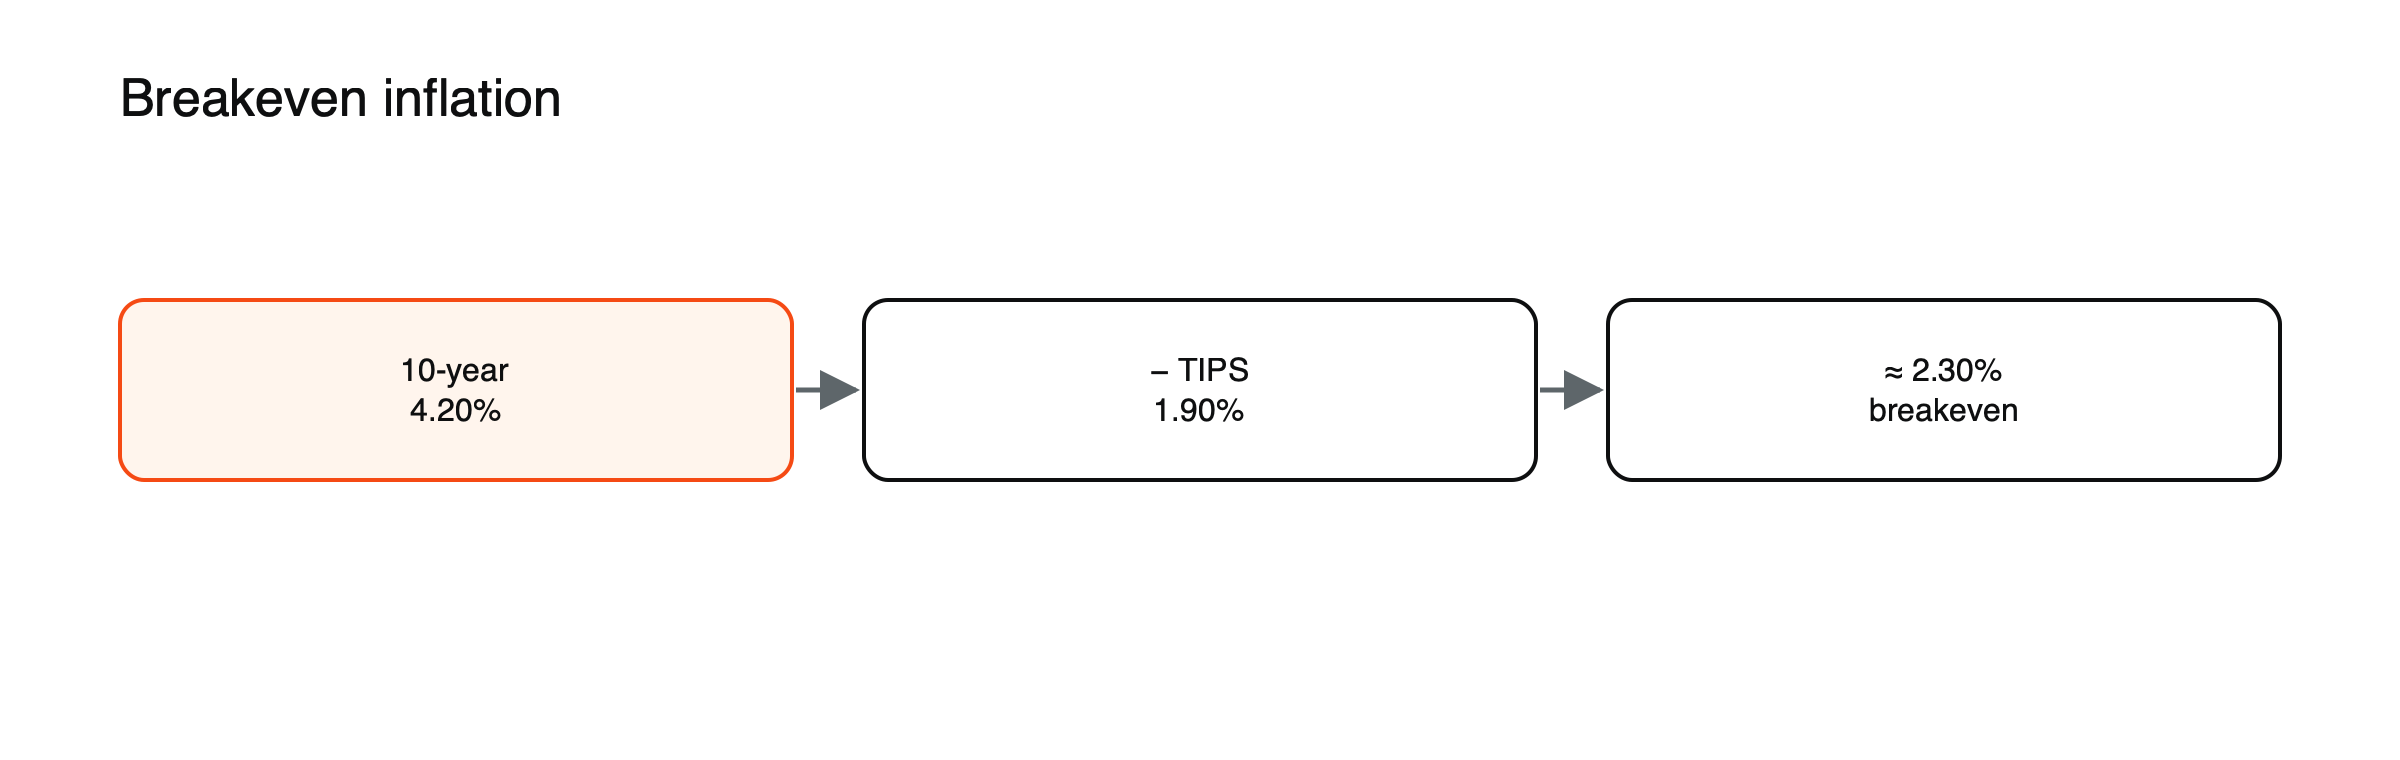
Figure: Reading breakeven inflation (example values).
If you expect inflation above 2.3%, TIPS would beat the regular bond; below it, the regular bond wins. (Example values.)
TIPS or regular Treasuries, worked through
Suppose $10,000 is invested for ten years either in a regular note yielding 4.2% or in TIPS yielding 1.9% real. (Example values, ignoring taxes.) The regular note grows to about $15,090. If inflation averages 3%, the TIPS grows to about $16,222; if inflation averages 2%, to about $14,714. The breakeven of roughly 2.3% is where the two outcomes match. Choosing between them is a bet on whether inflation will come in above or below that level.
Breakevens at different horizons
Breakevens exist for several maturities, and comparing them shows the market’s expected inflation path. If the 5-year breakeven is 2.5% and the 10-year 2.3%, the implied average inflation for years six to ten, known as the 5-year, 5-year forward breakeven, is about 2.1%. (Example values.) Central banks watch this longer-term measure closely, because it shows whether markets believe inflation will return to target.
What moves breakevens
Energy prices, inflation data, central bank credibility and demand for inflation protection.
Oil and breakevens
Shorter-term breakevens are especially sensitive to oil prices, because energy feeds quickly into consumer inflation. A sharp rise in oil can lift the 2-year or 5-year breakeven within days, while longer breakevens move less if markets expect the shock to pass. Watching both helps separate temporary price spikes from a lasting change in inflation expectations.
Central bank credibility
If investors trust a central bank to keep inflation near its target, long-term breakevens stay close to that target even when current inflation is high. A sustained rise in long-term breakevens is a warning that confidence is slipping, and central banks often respond with tougher policy.
Caveats
Breakevens include risk and liquidity premiums, so they are not a pure forecast; TIPS can trade less easily in stress.
Reading the split
A rise in nominal yields can come from higher real yields or higher breakevens, with different meanings. In the 2013 taper tantrum, real yields jumped while 5-year breakevens fell from 1.99% to 1.65%, showing the move was about tighter policy, not inflation.
See how to calculate a real yield, what moves the 10-year Treasury yield and how bonds work.
The liquidity premium, illustrated
TIPS are less traded than regular Treasuries, so investors usually demand a little extra yield to hold them. That extra yield lowers the measured breakeven. Suppose true inflation expectations are 2.5% but TIPS carry a liquidity premium of 0.2 points: the breakeven shows about 2.3%. (Illustrative figures.) In stressed markets, the premium can jump, making breakevens fall sharply even if inflation expectations barely change, as happened briefly in March 2020.
Breakevens versus surveys
Surveys of households, businesses and economists also measure inflation expectations. Breakevens update every second and reflect money at stake, but include risk and liquidity premiums; surveys are less frequent and can be influenced by recent prices at the gas pump. Looking at both gives a more complete picture.
Inflation swaps
Professional investors also measure inflation expectations through inflation swaps, in which one side pays a fixed rate and the other pays actual inflation. The fixed rate is another market estimate of expected inflation, often close to the breakeven but less affected by TIPS liquidity. Central banks watch both.
Breakevens outside the United States
Other countries issue inflation-linked bonds too. The UK has a long-established market in index-linked gilts, historically tied to the retail prices index, and euro-area governments issue bonds linked to euro-area inflation. Breakevens from these markets show inflation expectations in each economy and can differ widely from US measures.
The deflation floor
At maturity, US TIPS repay at least their original face value even if cumulative deflation has reduced the inflation-adjusted principal below it. This floor is worth most for newly issued TIPS when deflation risk is high, and it can slightly distort breakevens in such periods.
Trading breakevens
Traders who want a pure view on inflation, rather than on interest rates, can buy TIPS and sell regular Treasuries of the same maturity, or the reverse. The position gains if breakevens widen, regardless of whether yields overall rise or fall. Such trades are mostly the preserve of institutions, but breakeven moves are useful context for anyone trading bonds, gold or currencies.
Reading daily moves
Breakevens move every day with oil prices, inflation data and risk appetite. A rise of 0.05 points in a day is common; a rise of 0.20 points in a week signals a meaningful shift. Comparing moves in breakevens and real yields shows whether a change in nominal yields reflects inflation or policy.
Common misreadings
- Treating the breakeven as an exact inflation forecast.
- Ignoring liquidity effects in stressed markets.
Breakevens through a tightening cycle
When inflation first surges, short-term breakevens usually rise quickly as markets price higher prices ahead. Once the central bank responds forcefully, breakevens often stabilize or fall, while real yields rise, because markets come to believe inflation will be brought under control. That pattern played out broadly in 2022: nominal yields kept rising, but more of the increase came from real yields as tightening continued. The split showed markets trusted the Fed’s commitment.
Breakevens and other markets
Rising breakevens tend to support commodities and gold, which investors often see as inflation hedges, and can weigh on long-term bonds. Falling breakevens, especially when real yields rise, are often a headwind for gold. Traders in commodities and currencies watch breakevens alongside real yields to judge which force is driving markets. See why gold falls when real yields rise.
A breakeven checklist
- What are the 5-year and 10-year breakevens?
- Is the 5-year, 5-year forward measure near the central bank’s target?
- Are oil prices driving short-term moves?
- Is liquidity in TIPS normal or stressed?
Why breakevens matter beyond bonds
Breakevens offer anyone a quick read on how much inflation markets expect, which matters for decisions about savings, wages and borrowing. If long-term breakevens stay near 2% while current inflation is high, markets expect the surge to fade; if they climb steadily, they expect inflation to persist. Many central bank speeches refer to market-based expectations for exactly this reason.
Inflation-linked bond funds
Individual investors usually gain access to TIPS and other inflation-linked bonds through funds and ETFs. These protect against inflation over time, but their prices still move with real yields, sometimes sharply. In 2022, many inflation-linked funds fell despite high inflation, because rising real yields outweighed the inflation adjustments. Matching the fund’s duration to the time horizon matters as much as for ordinary bond funds.
Short and long breakevens diverging, illustrated
Suppose oil prices jump 30% in a month on a supply shock. (Illustrative scenario.) The 2-year breakeven might rise from 2.4% to 3.0%, as markets price higher near-term inflation, while the 10-year breakeven rises only from 2.3% to 2.4%, because markets expect the shock to fade and the central bank to respond. The gap between the two shows that investors see the inflation burst as temporary. If the 10-year breakeven also climbed sharply, it would signal fear of lasting inflation. Comparing both measures during shocks clarifies the market’s view.
Frequently asked questions
Is the breakeven a forecast of inflation?
It is the market’s priced-in inflation rate, close to expectations but distorted by risk and liquidity premiums.
Where can I see breakevens?
Central banks and financial data sites publish 5-year and 10-year breakevens daily, along with the 5-year, 5-year forward measure.
Leverage, margin and cost figures in this article are example values for illustration. Actual terms depend on the provider, the instrument and the rules in your country.
This article is educational content and does not constitute financial, investment, legal or tax advice. Digital assets are volatile and you may lose the amount you invest.