
What Happened on Black Monday 1987?
On October 19, 1987, the Dow fell 508 points, or 22.6%, its largest one-day percentage drop. The causes, portfolio insurance and the circuit breakers after.
Black Monday was October 19, 1987, when the Dow fell 508 points, or 22.6%, its largest one-day percentage decline, and markets worldwide crashed with it. Automated “portfolio insurance” futures selling, a falling dollar and a sudden loss of confidence are seen as the causes. Circuit breakers followed; the Dow recovered by mid-1989.
Timeline
- October 14–16, 1987: US stocks fall sharply; the Dow drops 4.6% on Friday the 16th.
- October 19, morning: heavy sell orders build before the open; many stocks cannot open on time.
- Through the day: index futures fall first and fastest; selling accelerates in the last 90 minutes.
- Close: the Dow is down 508 points, or 22.6%.
- October 20: liquidity problems in the clearing system threaten the market; the Fed promises support.
- Mid-1989: the Dow regains its pre-crash level.
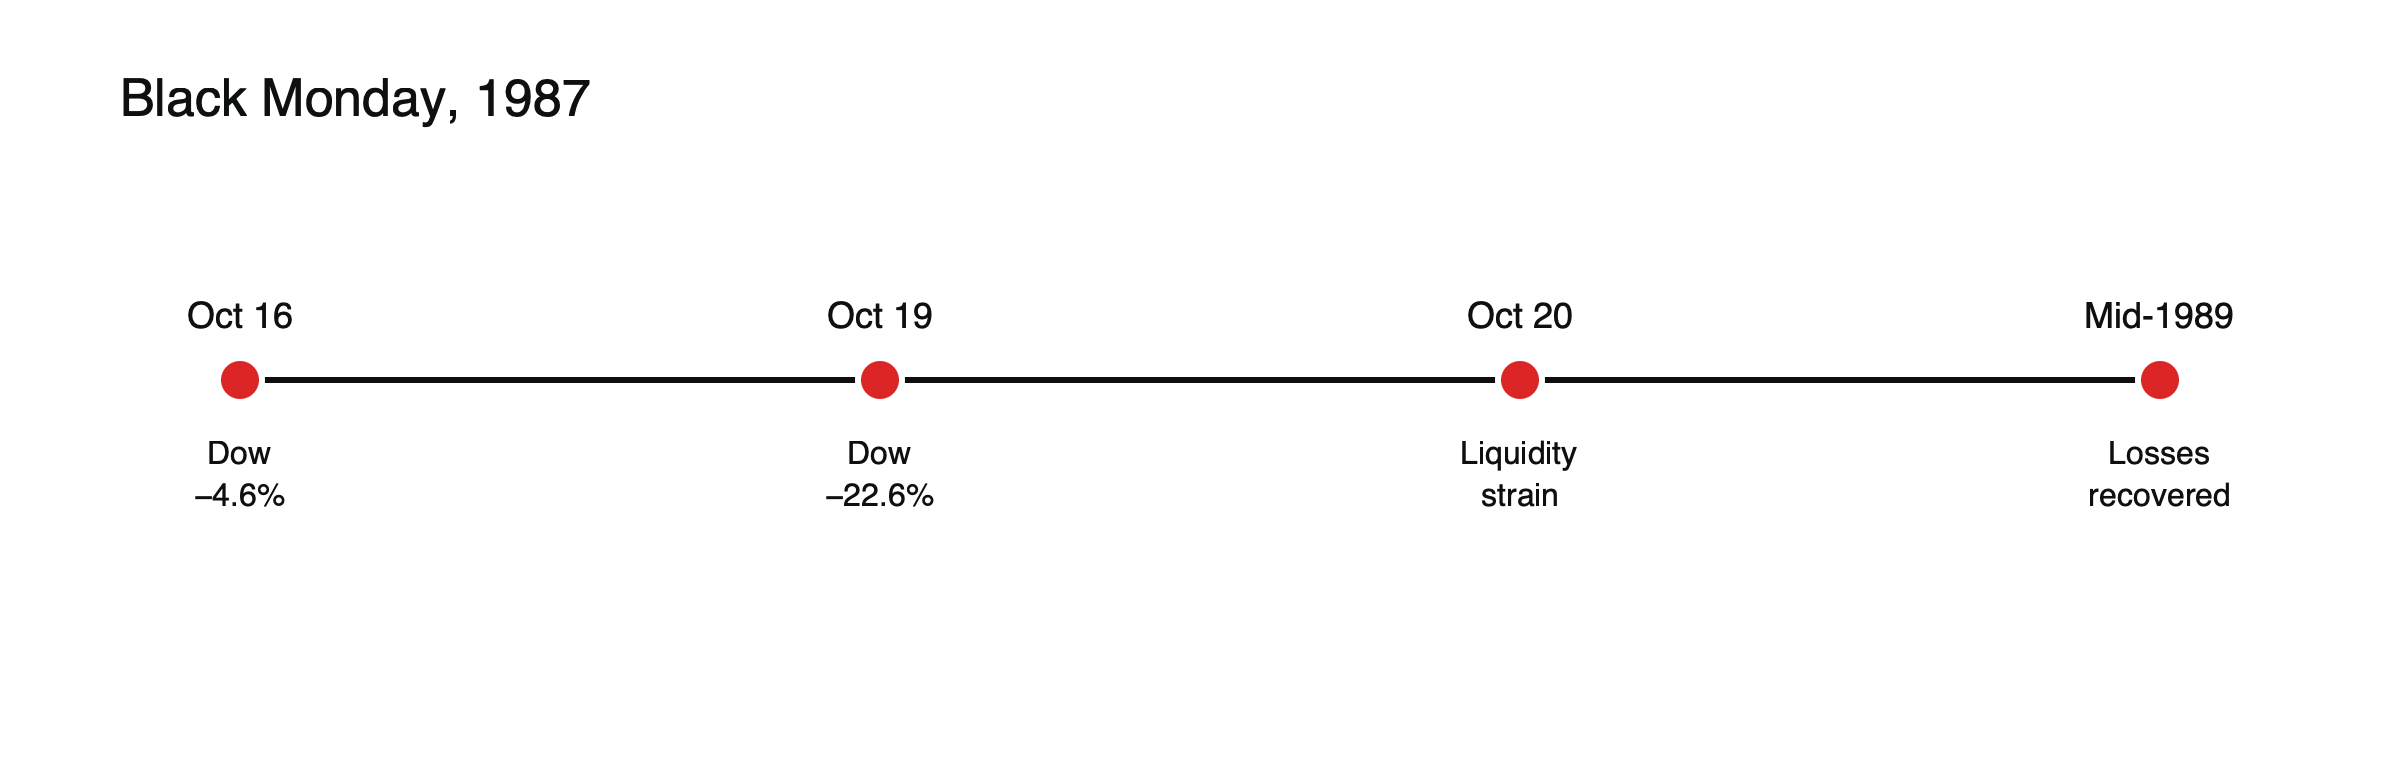
Figure: Black Monday in context.
The weeks before
US shares had risen strongly in 1987, and valuations were stretched. Through the autumn, bond yields climbed, the dollar weakened and the US trade deficit worried investors. In the week before the crash, news of a proposed tax change affecting corporate takeovers and a disappointing trade figure added to the selling. By Friday, October 16, the market was already falling hard, and many investors went into the weekend anxious about Monday.
Portfolio insurance, illustrated
Portfolio insurance promised to limit a fund’s losses by selling index futures as the market fell, gradually reducing exposure, and buying them back as it rose. Suppose a fund with $1 billion of shares is programmed to sell futures worth 10% of its exposure for every 5% fall. (Illustrative rule.) If many funds follow similar rules at once, a 5% fall triggers billions of dollars of futures sales, which push futures lower, which in turn pushes share prices down through arbitrage, triggering the next round of selling. On October 19, this feedback loop overwhelmed the buyers available.
Around the world
The crash spread globally. Toronto fell about 11% the same day, roughly half the US decline, while some markets with little portfolio insurance also fell sharply, suggesting fear was contagious.
Why it happened
Portfolio insurance: computer-driven strategies sold index futures as prices fell, which pushed futures lower and triggered more selling, a feedback loop.
Other factors: worries about the dollar, rising rates and stretched valuations after a strong rally.
The Federal Reserve steps in
Before markets opened on Tuesday, October 20, the Federal Reserve issued a short statement affirming its readiness to serve as a source of liquidity to support the economic and financial system. It encouraged banks to keep lending to securities firms, which needed credit to settle the huge volume of trades. The intervention helped prevent the market crash from turning into a wider financial crisis, and it set a pattern for central bank responses to later market panics.
Why the economy did not follow
Despite the size of the fall, the US economy did not slide into recession in 1988. The crash had been driven largely by market mechanics and sentiment rather than by a collapse in corporate profits, and the quick provision of liquidity limited the damage. That contrast is one reason Black Monday is studied as an example of how markets can move far more violently than the economy beneath them.
What changed
Exchanges introduced circuit breakers, trading pauses that kick in after large falls. See how stock market circuit breakers work.
The official investigation
A presidential task force, known as the Brady Commission after its chairman, examined the crash. It concluded that stock, futures and options markets were really one market linked by arbitrage, that portfolio insurance and related strategies had amplified the fall and that coordinated mechanisms such as circuit breakers were needed. Its recommendations shaped market rules for decades.
Lessons
Strategies that sell into falling prices can amplify crashes; liquidity can vanish exactly when it is needed. See what caused the 2010 flash crash and what moves stock market indices.
Timeline at a glance
| Date | Event |
|---|---|
| October 14–16, 1987 | Sharp falls; the Dow drops 4.6% on Friday |
| Monday, October 19 | Dow −508 points, −22.6% |
| Tuesday, October 20 | Fed liquidity statement; clearing strains |
| 1988 | Circuit breakers introduced |
| Mid-1989 | Dow regains its pre-crash level |
Could it happen again?
Circuit breakers now pause trading after large falls, which would prevent a 22% fall in a single uninterrupted session. But automated strategies that sell into falling markets still exist in new forms, such as volatility-targeting funds and products that rebalance daily, and liquidity can still disappear quickly. The 2010 flash crash and the 2018 volatility spike showed that markets can move violently even with modern safeguards. See what Volmageddon was.
Lessons for CFD traders
A 22% fall in one day would have overwhelmed most leveraged index positions many times over. Stop orders would have been filled far below their levels as prices gapped. Even with modern circuit breakers, gaps after halts or at the open can exceed planned losses. Sizing index positions so that an extreme day is survivable, rather than only a typical one, is the main lesson. See how stock market circuit breakers work.
Market makers overwhelmed
On the New York Stock Exchange, specialists were responsible for keeping orderly markets in their stocks, buying when others sold. On October 19, the volume of sell orders was so large that many could not cope, and some stocks could not open for an hour or more. Order systems were swamped, confirmations were delayed and investors did not know whether their orders had been executed or at what price.
Futures and shares out of step
With many stocks not trading, index futures fell first and faster than the cash index, which was calculated from stale prices. Arbitrage traders, who normally keep the two in line by buying the cheaper and selling the dearer, found it impossible to execute their trades reliably. The disconnect added to confusion and made the true level of the market hard to judge for much of the day.
Investors afterward
Many individual investors who sold in the panic missed the recovery, while those who held on or bought regained their losses within two years. The episode became a frequently cited example of why selling in a panic often locks in losses.
Common misreadings
- Assuming the crash was caused by bad economic news.
- Believing circuit breakers make large falls impossible.
Global markets in detail
The crash began in Asia and Europe on October 19 before reaching New York, and continued in Asia the next day. Hong Kong’s stock exchange closed for four days in an attempt to stop the panic; when it reopened, its index fell sharply. Markets in Australia, New Zealand, Britain and elsewhere suffered heavy losses. The global spread showed how connected markets had become, even before electronic trading linked them around the clock.
Compared with 1929
The 1987 crash was larger in a single day than any day in the 1929 crash, but its aftermath was very different. In 1929, the fall was followed by years of declining share prices, bank failures and the Great Depression, partly because policymakers allowed credit to contract. In 1987, the Federal Reserve supplied liquidity immediately, banks kept lending and the economy kept growing. The contrast is often cited as evidence of how much central bank responses matter in a crisis.
Program trading after 1987
After the crash, exchanges imposed restrictions on program trading during volatile periods, such as limits that applied after large moves. Over time, many of these specific rules were replaced, but the principle of slowing automated selling when markets fall sharply remains embedded in modern circuit breakers and price bands. Those mechanisms are a direct legacy of the hard lessons learned in October 1987 and its aftermath.
Frequently asked questions
Was Black Monday the worst day in stock market history?
In percentage terms, it remains the Dow’s largest one-day fall.
Did the market recover?
Yes. The Dow regained its pre-crash level by mid-1989, far faster than after the 1929 crash or the 2000 peak.
This article is educational content and does not constitute financial, investment, legal or tax advice. Digital assets are volatile and you may lose the amount you invest.
Sources
- Lessons from Black Monday (Dow −508 points, −22.6%; portfolio insurance; circuit breakers introduced) — The Globe and Mail
- Black Monday (1987) (Dow −4.6% on October 16; selling in the last 90 minutes; Tuesday liquidity problem) — Wikipedia
- Black Monday 1987 (portfolio insurance feedback; recovery by mid-1989) — Fin Still
- Two mysterious crashes (on Black Monday futures fell first and fastest) — McGraw-Hill course material