
What Is Market Breadth?
Market breadth measures how many stocks take part in a move. How the advance-decline line and equal-weight comparisons work, and why narrow rallies are fragile.
Market breadth measures how many stocks take part in a move, rather than how far the index moves. A broad rally is generally seen as healthier than a narrow one led by a few giants. With the S&P 500’s top 10 at a record 40.7% of the index in 2025, breadth shows whether index gains reflect the typical stock.
Common breadth measures
- Advance-decline line: a running total of rising minus falling stocks each day.
- New highs vs new lows: how many stocks hit 52-week highs compared with lows.
- Share above a moving average: the percentage of index members trading above, say, their 200-day average.
- Equal-weight vs cap-weight: comparing an equal-weighted index with the standard version shows whether the average stock is keeping up.
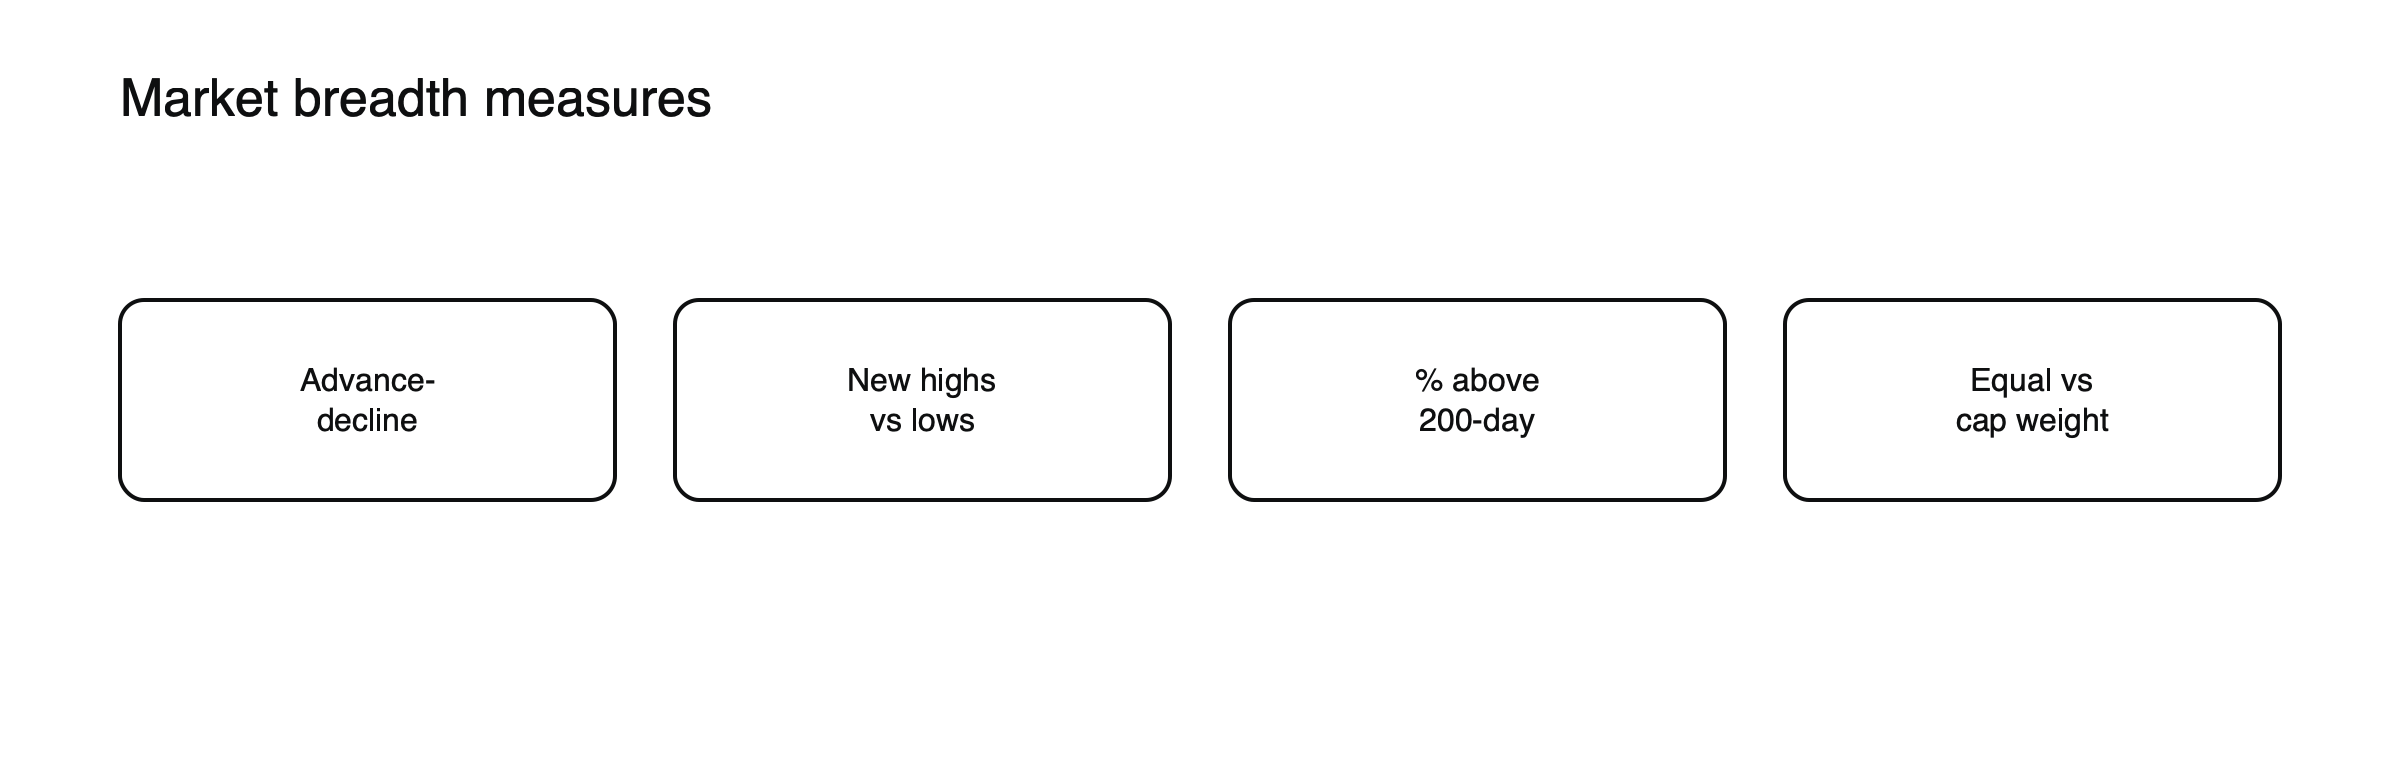
Figure: Ways to measure participation.
The advance-decline line, illustrated
Suppose on Monday 300 members of an index rise and 200 fall, a net of +100; on Tuesday 150 rise and 350 fall, −200; on Wednesday 280 rise and 220 fall, +60. (Illustrative figures.) The advance-decline line adds these up: +100, then −100, then −40. If the index itself rose on Tuesday because a few giants climbed, the line’s fall shows that most stocks did not take part. Over weeks, the line’s direction compared with the index’s tells you how broad a move really is.
Percentage above the 200-day average, illustrated
If 70% of an index’s members trade above their 200-day moving averages, most stocks are in longer-term uptrends; if only 30% do, most are not, whatever the headline index is doing. Readings above about 80% often appear after strong, broad rallies, and below 20% during deep sell-offs. Extremes can mark exhaustion, though they can persist.
Why it matters
When an index rises while most members fall, gains depend on a few stocks; if they stumble, the index has little support. The Magnificent Seven drove most of the S&P 500’s returns in 2023 and 2024, and the index has pulled away from its equal-weighted version.
2023 and 2024
In 2023 and 2024, a small group of very large technology companies, often called the Magnificent Seven, accounted for most of the S&P 500’s gains, while many other members lagged. Breadth measures showed the narrowness of the rally even as the index set records, and the equal-weighted S&P 500 trailed the standard version by a wide margin. The episode showed how breadth can diverge from an index for long periods without the index falling.
Divergences
A rising index with a falling advance-decline line is a classic warning sign, though it can persist for long periods.
Limits. Breadth signals are slow and imprecise; narrow markets can keep rising for years. Use breadth as context alongside other evidence.
See why a handful of stocks can drive an entire index, how stock index CFDs work and what moves stock market indices.
Breadth thrusts
Occasionally, a very large share of stocks rises together over a few days, for example when the share of advancing stocks jumps from very low to very high levels in a short time. Such breadth thrusts have often appeared near the start of new rallies after sell-offs, as buying spreads across the market. They are rare and not infallible, but traders watch for them after sharp declines.
Breadth at market bottoms
Market lows often feature extreme readings: very few stocks above their moving averages, many new lows and heavily negative advance-decline figures. As a decline matures, breadth sometimes improves before the index stops falling, with fewer stocks hitting new lows even as the index makes another low. That divergence can hint that selling is exhausting itself.
Comparing breadth across indices
Comparing the S&P 500 with its equal-weighted version, the Russell 2000 or mid-cap indices gives a quick breadth check without special data. When the standard index rises while equal-weighted and small-cap indices lag, the rally is narrow; when they lead, it is broad. See Russell 2000 vs S&P 500.
Where to find breadth data
Many charting platforms and financial websites publish advance-decline lines, new highs and lows and the share of stocks above moving averages for major indices. Exchange data and index providers’ equal-weighted indices are also widely available.
The McClellan oscillator
One widely followed breadth indicator, the McClellan oscillator, compares short- and longer-term moving averages of daily advances minus declines. Readings far above zero show strong, broad buying; far below zero, broad selling. Extreme readings often appear near short-term turning points, and its cumulative version, the McClellan summation index, tracks longer-term breadth trends.
Sector breadth
Breadth can also be measured across sectors: how many of the eleven sectors are rising, or trading above their moving averages. A rally led by one or two sectors is narrower than one in which most sectors participate, even if the number of rising stocks looks healthy. Sector breadth often reveals whether a market is rotating or moving together. See what sector rotation is.
Breadth and volume
Some measures weigh breadth by trading volume, comparing the volume in rising stocks with the volume in falling ones. A rally on heavy volume in advancing stocks suggests strong conviction; one where most volume goes into falling stocks suggests distribution, even if the index rises. Volume-based breadth can confirm or question what simple counts show.
A simple breadth dashboard
- Cap-weighted index versus its equal-weighted version.
- Advance-decline line.
- Share of members above their 200-day average.
- New 52-week highs versus new lows.
Checking these four once a week gives a quick picture of whether index moves are broad or narrow.
Common misreadings
- Treating weak breadth as a timing signal.
- Ignoring breadth because the index is rising.
A breadth divergence, illustrated
Suppose an index rises 6% over two months to a new high, while the share of its members above their 200-day averages falls from 75% to 50%, and new 52-week highs shrink each week. (Illustrative scenario.) The index’s gains now rest on fewer stocks. If its leaders stumble, there is less support from the rest of the market. A trader holding a long index position might respond by tightening risk control or reducing size, rather than reversing the position outright.
Breadth outside the United States
Breadth measures can be applied to any index. In Europe and Japan, where indices are often less concentrated in a few giants than the S&P 500, breadth and the headline index tend to move together more closely. Comparing breadth across regions can show whether a global rally is broad or driven by a few markets or sectors.
After a sell-off
After a sharp decline, breadth helps judge whether a rebound is likely to last. If the first rally after the low is led by many stocks across many sectors, with the share above short-term moving averages jumping and new lows disappearing, the recovery has broad support. If only a few large companies bounce while most stocks stay near their lows, the rebound is fragile and may fail. Traders often wait for breadth to confirm a recovery before adding to long index positions, accepting a slightly later entry in exchange for more evidence.
Combining breadth with other signals
Breadth works best alongside other evidence, such as earnings trends, interest rates and volatility. A rally with improving breadth, falling volatility and rising earnings forecasts is on firmer ground than one where breadth narrows while volatility rises.
Frequently asked questions
Does weak breadth mean the market will fall?
Not necessarily. Narrow rallies can continue for long periods. Weak breadth means the index depends on fewer stocks, which raises the risk if they falter.
How can index CFD traders use breadth?
As context. Strong breadth supports holding index positions; weakening breadth during a rally argues for caution, tighter risk control or smaller size.
This article is educational content and does not constitute financial, investment, legal or tax advice. Digital assets are volatile and you may lose the amount you invest.
Sources
- Stock market concentration statistics (top 10 a record 40.7% at end-2025; Magnificent Seven 34.3%; drove most 2023–2024 returns) — Walnut, 2026
- What past sector concentrations tell us about today’s tech-heavy S&P 500 (IT near 40%; S&P 500 pulling away from its equal-weighted version) — CME Group, 2026