
What Caused the Dot-Com Crash?
The Nasdaq peaked at 5,048 in March 2000, fell about 78% by October 2002 and took 15 years to recover. What caused the dot-com bubble and crash, the lessons.
The dot-com crash was the collapse of internet and tech stocks from 2000 to 2002. The Nasdaq peaked at 5,048.62 on March 10, 2000, after rising 86% in 1999, then fell about 78% to 1,114 by October 2002, and only set a new closing high in April 2015. Many richly valued companies without profits disappeared.
What caused the bubble
- Excitement about the internet and real productivity gains.
- A wave of IPOs for companies with little revenue. See what an IPO is.
- Extreme valuations: the Nasdaq traded at about 190 times earnings at its peak.
- Easy money and new retail investors drawn in by rising prices.
Timeline
- 1995–1999: the Nasdaq rises about 400%.
- March 10, 2000: closing peak of 5,048.62.
- April 2000: the index falls to about 3,227.
- 2001: recession; the September 11 attacks.
- October 2002: bottom at about 1,114.
- April 2015: new closing high above the 2000 peak.
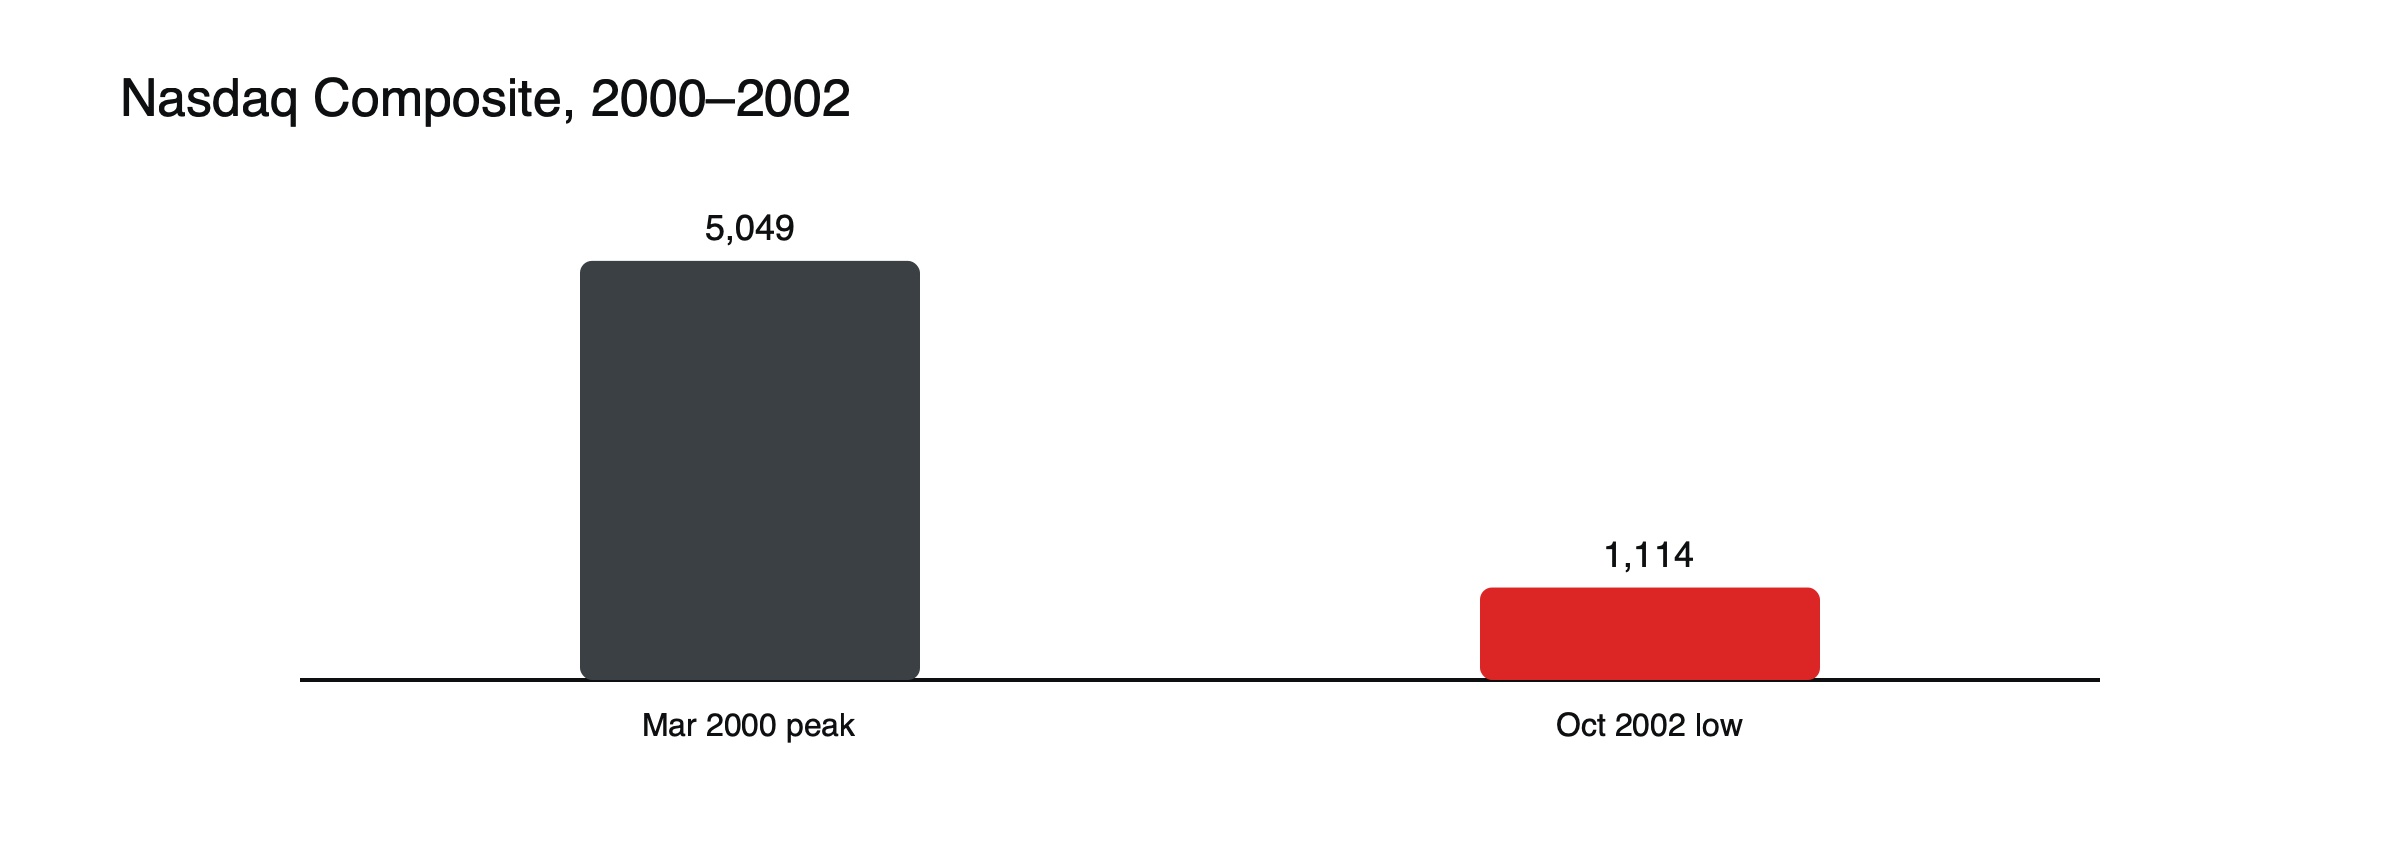
Figure: The Nasdaq’s dot-com fall. Sources: AFP; Goldman Sachs.
Companies that defined the era
Many internet companies went public with little revenue and no profits, raising money on the strength of website traffic and growth plans. Pets.com, which listed in early 2000, was liquidated before the end of the same year; online grocer Webvan, which raised large sums to build warehouses, went bankrupt in 2001. At the other end, Cisco, which supplied networking equipment for the internet build-out, briefly became the world’s most valuable company in March 2000, then lost most of its value. Amazon’s shares fell from about $113 to $5.51, more than 90%, before it grew into one of the world’s largest companies.
The Federal Reserve’s role
The Federal Reserve raised interest rates several times in 1999 and 2000 as the economy ran hot. Higher rates raised borrowing costs and reduced the value of distant profits, the same mechanism that later hit technology shares in 2022. Once the bubble burst and the economy slowed, the Fed cut rates sharply in 2001. See how interest rates affect stock prices.
The telecom bust
Alongside internet companies, telecom firms had borrowed heavily to lay fiber-optic networks in expectation of explosive demand. Much of that capacity went unused for years, and many telecom companies collapsed under their debts. The loss of value in telecoms rivaled that in internet shares and spread losses to banks and bond investors.
Why it hit the Nasdaq hardest
The Nasdaq was concentrated in technology. The S&P 500 fell about 44% over the same period and regained its high by 2007.
Scandals and new rules
The years after the crash exposed accounting fraud at several large companies, most notably Enron in 2001 and WorldCom in 2002, which had inflated profits and hidden debts. The scandals deepened the loss of confidence in markets and led to the Sarbanes-Oxley Act of 2002, which tightened rules on corporate accounting, auditing and executive responsibility for financial statements.
Lessons
Revolutionary technologies can still produce bad investments; valuation eventually matters; concentration in one theme raises risk. Some survivors, such as Amazon, went on to thrive after falling more than 90%. See why a handful of stocks can drive an entire index and what moves stock prices.
Echoes in later booms
Investors have compared later rallies, such as the 2020–2021 surge in technology shares and the excitement around artificial intelligence, with the dot-com era. There are similarities, such as heavy concentration in a few themes and enthusiastic retail participation, and differences, such as the much larger profits of today’s leading technology companies. The lesson from 2000 is not that technology booms must end in the same way, but that even transformative technologies can be priced for more than they will deliver.
Lessons for traders
The crash showed how quickly sentiment can reverse after long rallies, how leverage and concentration in one theme multiply losses and how long recoveries can take: the Nasdaq needed about 15 years to regain its 2000 peak. For traders using CFDs, the rapid falls of 2000 and 2001, with frequent sharp rallies along the way, were especially dangerous, because short rallies tempted traders back in before further declines.
Timeline at a glance
| Date | Event | Nasdaq |
|---|---|---|
| 1995–1999 | Internet boom; wave of IPOs | Rises about 400% |
| March 10, 2000 | Closing peak | 5,048.62 |
| April 2000 | Sharp sell-off | About 3,227 |
| 2001 | Recession; September 11 attacks; Enron collapse | Falling |
| October 2002 | Bottom | About 1,114 |
| April 2015 | New closing high | Above 5,048 |
The psychology of the bubble
As prices rose month after month, many investors stopped asking what companies would earn and focused on how much shares had risen. Stories of quick fortunes drew in people who had never invested before, and some quit their jobs to trade. Skeptics who warned about valuations were dismissed as not understanding the new economy. When prices turned, the same crowd behavior worked in reverse, as investors rushed to sell.
New ways to justify valuations
Because many internet companies had no profits, analysts turned to measures such as website visitors, page views and revenue growth to justify their valuations. These measures said little about whether the businesses could ever make money. The experience left a lasting skepticism toward valuation methods that ignore profits and cash flow altogether.
What survived
The infrastructure built during the boom, including fiber-optic networks, data centers and software, did not disappear. Much of it was bought cheaply after the crash and later supported the growth of online services, from search and e-commerce to streaming. The technology was real; the prices paid for it in 2000 were not.
Beyond the United States
The bubble and its collapse were global. Technology shares in Europe and Asia rose and fell with the Nasdaq, and Germany’s Neuer Markt, a growth segment created for young technology companies, collapsed and was closed in 2003.
Comparing with 1929
The dot-com crash is often compared with the 1929 crash. Both followed long rallies driven by new technology and broad public enthusiasm. The Nasdaq’s fall of about 78% was similar in scale to the decline of US stocks after 1929, though the wider economy suffered far less in the early 2000s, partly because policymakers cut rates quickly.
Borrowed money
Borrowing to buy shares rose sharply in the late 1990s as investors used margin loans to increase their bets on technology. When prices fell, margin calls forced many to sell at the worst moment, adding to the decline. The same mechanism appears in leveraged products today: a fall that might be survivable without borrowing can wipe out an account that used high leverage. See what margin calls and stop-outs are.
How long recovery took
The Nasdaq index took about 15 years to regain its 2000 peak, but individual shares had very different fates. Some never recovered because their companies disappeared. Others, including several large technology firms that survived, took a decade or more to regain their highs. A handful went on to far exceed them. Investors who held a diversified basket bought at the peak needed patience measured in years, not months.
Lessons for long-term investors
For long-term investors, the crash showed the value of diversification across sectors and of rebalancing, trimming positions that have grown far beyond their intended weight. It also showed that buying great businesses at any price can still produce poor returns for many years. Those principles apply just as much to concentrated bets on any popular market theme today, whatever the specific technology involved.
Frequently asked questions
Were all dot-com companies bad investments?
No. Some, such as Amazon, survived and became enormously successful, but investors who bought near the peak waited many years to recover their losses.
Could a similar crash happen again?
Bubbles have recurred throughout history, though never in exactly the same form. Extreme valuations, concentration in one theme and heavy use of leverage are the warning signs most often cited.
This article is educational content and does not constitute financial, investment, legal or tax advice. Digital assets are volatile and you may lose the amount you invest.
Sources
- 2000 dot-com bubble (Nasdaq +86% in 1999; peak March 10, 2000; −77% by October 2002; new high April 23, 2015) — Goldman Sachs history
- Nasdaq shakes off dot-com losses (closing high 5,048.62; bottom 1,114.11; P/E about 190 at the peak) — AFP via BizNews, April 2015
- Nasdaq reaches for dot-com peak (S&P 500 −44% over the same period) — AP via BenefitsPro
- The dot-com bubble 1995–2000 (Nasdaq +400% 1995–2000; Amazon from $113 to $5.51) — Fin Still