
How to Read an Income Statement
Start with revenue, subtract costs to gross profit, operating income and net income, check margins and one-off items: how to read an income statement.
To read an income statement, start with revenue, follow each cost line down to gross profit, operating income and net income, calculate margins at each stage, compare with prior periods and check for one-off items. The income statement shows how much a company earned over a period, such as a quarter or year.
Before you start
Have the current and prior-year statements side by side. Annual and quarterly reports are filed with regulators, such as on the SEC’s EDGAR system in the US.
Reading it, line by line
Revenue
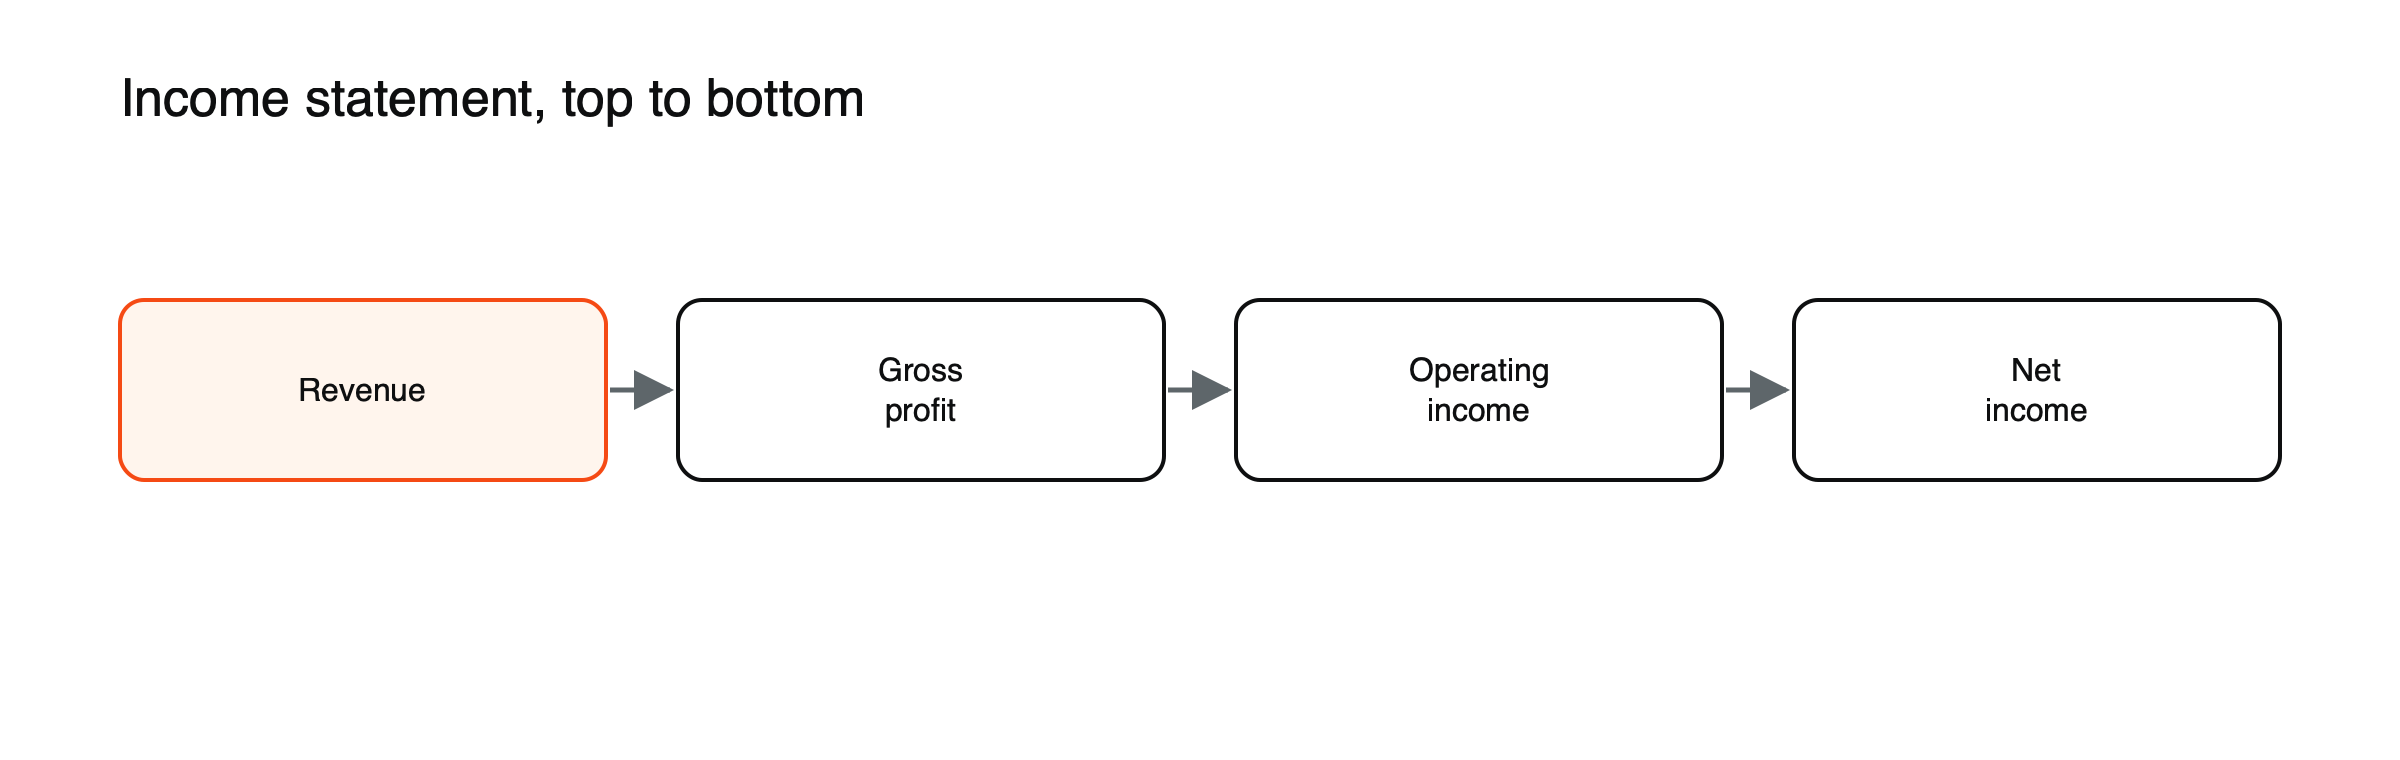
Figure: Reading top to bottom.
Total sales. Check growth versus the prior period.
Cost of goods sold and gross profit
Direct costs of producing what was sold. Revenue minus these is gross profit. See how to calculate gross, operating and net margin.
Operating expenses and operating income
Selling, administrative and research costs. Gross profit minus these is operating income, the profit from the core business.
Interest, tax and net income
Subtract interest and tax to reach net income, then divide by shares for EPS. See how earnings per share is calculated.
Look for one-offs
Restructuring charges, asset sales and write-downs can distort results; check notes and “adjusted” figures.
ExampleCo’s income statement
| Line | $ million | Margin |
|---|---|---|
| Revenue | 1,000 | |
| Cost of goods sold | (600) | |
| Gross profit | 400 | 40% |
| Selling, general and administrative | (180) | |
| Research and development | (70) | |
| Operating income | 150 | 15% |
| Interest expense | (20) | |
| Profit before tax | 130 | |
| Tax at 25% | (32.5) | |
| Net income | 97.5 | 9.75% |
| Shares | 50 million | |
| EPS | $1.95 |
(Hypothetical company.) Each subtotal answers a different question: gross profit shows pricing power over direct costs, operating income shows the profitability of the core business and net income shows what is left for shareholders after financing and tax. See how to calculate gross, operating and net margin.
Comparing two years
Suppose last year ExampleCo had revenue of $900 million and operating income of $126 million, a 14% margin. This year revenue grew about 11% and operating income about 19%, so the margin widened to 15%. Profits growing faster than sales, known as operating leverage, often means fixed costs are being spread over more revenue. The reverse, costs growing faster than sales, is an early warning sign. (Hypothetical figures.)
Common mistakes
Looking only at net income, ignoring margin trends, and forgetting that profit is not the same as cash. See how to read a cash flow statement and what moves stock prices.
What the income statement does not show
The income statement records revenue when it is earned and costs when they are incurred, not when cash changes hands. A company can report a profit while customers have not yet paid, or while it spends heavily on new equipment that appears only gradually as depreciation. That is why the income statement should always be read alongside the cash flow statement and the balance sheet, which show cash and financial position.
Quarterly versus annual statements
Listed companies publish quarterly results as well as annual reports. Quarterly figures are timelier but can be affected by seasonality, so comparing a quarter with the same quarter a year earlier is usually more meaningful than comparing it with the previous quarter. Annual statements are audited and contain fuller notes.
Items worth reading in the notes
- How revenue is recognized, especially for long contracts or subscriptions.
- Breakdowns of revenue by segment and region.
- Details of restructuring, impairment and other unusual charges.
- Share-based compensation, which is a real cost even though it uses no cash.
Operating leverage in reverse, illustrated
Suppose ExampleCo’s revenue falls 10% to $900 million while its gross margin stays at 40% and its operating expenses of $250 million cannot be cut quickly. Gross profit falls to $360 million and operating income to $110 million, a drop of about 27% from $150 million. (Hypothetical figures.) Because many costs are fixed in the short run, a modest fall in sales can cause a much larger fall in profit. This is why cyclical companies’ earnings, and share prices, swing so much more than their revenue.
Revenue quality
Not all revenue is equal. Recurring revenue from subscriptions or long-term contracts is usually valued more highly than one-off sales, because it is more predictable. Growth driven by price increases tells a different story from growth driven by more customers. And revenue boosted by acquisitions should be separated from organic growth. Companies often provide these breakdowns in results releases and notes.
Segments and regions
Large companies report results for each business segment and often for each region. A company whose total revenue is flat may have one fast-growing segment hidden behind a declining one. Reading the segment breakdown shows where profits really come from and which parts of the business drive the share price.
Adjusted measures
Many companies publish adjusted figures that exclude items such as restructuring, acquisition costs or share-based pay. These can help show underlying trends, but definitions vary and are chosen by management. Reconciliations to the official figures are usually provided, and comparing the two over several years reveals how much the adjustments flatter results.
Margins across a cycle
Profit margins rise and fall with the economy, competition and costs. A company whose margins are at record highs may face pressure if competition increases or input costs rise; one with depressed margins may recover if conditions improve. Comparing current margins with their range over five or ten years helps judge whether today’s profits are normal, unusually high or unusually low, which matters for how much investors should pay for them.
The tax line
ExampleCo’s tax charge of $32.5 million on $130 million of pre-tax profit gives an effective tax rate of 25%. Real companies’ rates vary with the countries they operate in, tax credits and one-off items. A sudden fall in the tax rate can lift net income without any improvement in the business, so it is worth checking whether earnings growth came from operations or from tax. (Hypothetical figures.)
Interest cover
Dividing operating income by interest expense shows how easily a company can pay interest on its debt. ExampleCo’s operating income of $150 million is 7.5 times its $20 million interest bill, a comfortable cushion. Cover below about 2 or 3 times leaves little room if profits fall. (Hypothetical figures.) Lenders and rating agencies watch this ratio, and covenants in loan agreements often set minimum levels the company must maintain.
Frequently asked questions
Which line of the income statement matters most?
It depends on the question. For pricing power, look at gross margin; for the core business, operating income; for shareholders, net income and EPS. Trends in margins usually tell more than any single figure.
What is EBITDA, and is it on the income statement?
EBITDA, earnings before interest, tax, depreciation and amortization, is not usually a line on the statement but can be calculated from it. ExampleCo’s operating income of $150 million plus depreciation and amortization of $50 million gives EBITDA of $200 million. See what EV/EBITDA is.
This article is educational content and does not constitute financial, investment, legal or tax advice. Digital assets are volatile and you may lose the amount you invest.