
Russell 2000 vs S&P 500: Why Small Caps Behave Differently
The Russell 2000 tracks US small caps; the S&P 500 large caps. Why small caps are more sensitive to rates, credit and the domestic economy, compared.
Russell 2000 vs S&P 500 is small companies against large ones: about 2,000 smaller US firms versus about 500 large ones. Small caps depend more on the US economy, borrow more relative to size and have less pricing power, so they often react more to interest rates, credit conditions and recession fears.
Side by side
| Russell 2000 | S&P 500 | |
|---|---|---|
| Company size | Small caps | Large caps |
| Members | About 2,000 | About 500 |
| Revenue mostly from | The US | The US and abroad |
| Sensitivity to rates and credit | Higher | Lower |
| Profitability | Many members unprofitable | Mostly profitable |
| Concentration | Low | High (top 10 near 40%) |
| Volatility | Higher | Lower |
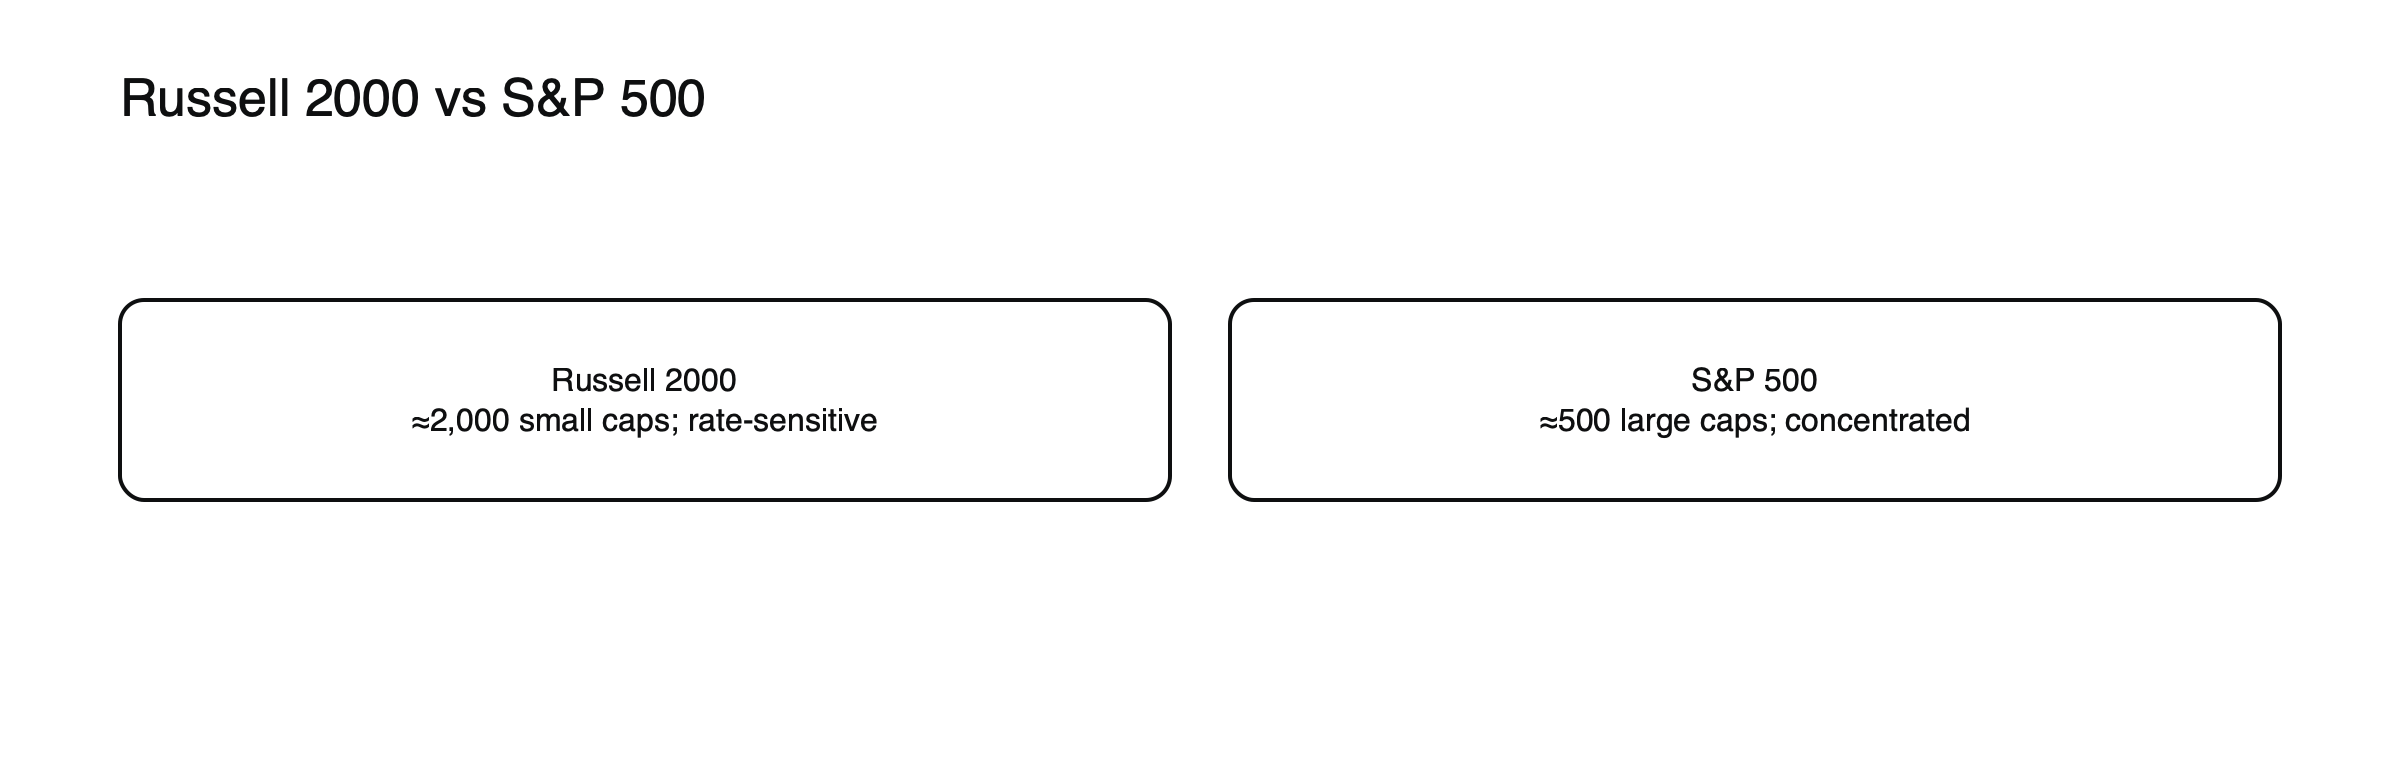
Figure: Small caps vs large caps.
2025 compared
In 2025, the Russell 2000 rose about 11.3%, behind the S&P 500’s 16.4%. Both fell sharply in the spring sell-off, the Russell 2000 by about 24% from its year high against about 19% for the S&P 500. From the April 8 low, the Russell 2000 rebounded about 41%, slightly more than the S&P 500’s 37%, a typical pattern: small caps fall harder in sell-offs and often bounce harder in recoveries.
Why small caps react differently
- Borrowing: smaller firms rely more on bank loans and floating-rate debt, so higher rates bite faster.
- Domestic focus: they track the US economy more closely.
- Liquidity: shares trade less, so moves can be sharper.
When small caps tend to do well. Early in recoveries, when rates are falling and growth is picking up, small caps have often outperformed. When growth slows or credit tightens, they tend to lag.
How the Russell 2000 is built
The Russell 2000 consists of the smaller two thousand companies within the Russell 3000, a broad index of US shares ranked by market value. Membership has traditionally been rebuilt once a year in a reconstitution, when companies are re-ranked and many move in or out at once, producing very heavy trading in affected shares around the effective date. Unlike the S&P 500, it has no profitability requirement, so many members are not profitable.
Rates and small caps, illustrated
Suppose short-term interest rates rise 2 percentage points. A small company with $300 million of floating-rate debt sees its annual interest bill rise by about $6 million, which may be a large share of its profit, while a large company with long-term fixed-rate bonds is barely affected until those bonds mature. (Illustrative figures.) This difference explains much of why the Russell 2000 tends to struggle when central banks tighten and to rally when rate cuts are expected.
Valuations
After years in which the largest US companies led the market, small caps have traded at lower valuations relative to their history than large caps, according to several analysts. Lower valuations can mean more room for gains if growth and rates turn favorable, but they can also reflect weaker profitability and higher borrowing costs among smaller companies.
When small caps offer broader exposure
Small caps are less concentrated, so they can offer broader diversification than a top-heavy S&P 500, even though each company is riskier.
See large-cap, mid-cap and small-cap stocks compared , what the S&P 500 is and how stock index CFDs work.
Trading a US 2000 CFD
Russell 2000 CFDs, often called US 2000 or US Small Cap 2000, are offered by many providers, though sometimes with wider spreads than the S&P 500 and with margin set as for a non-major index in some jurisdictions. Its daily moves in percentage terms are often larger than the S&P 500’s, so positions are typically sized smaller for the same risk. Checking the provider’s specification for margin, hours and costs before trading matters more than usual. See how stock index CFDs work.
Small caps versus large caps as a signal
The relative performance of the Russell 2000 against the S&P 500 is often read as a gauge of confidence in the US economy and expectations for interest rates. Small caps leading usually signals optimism about growth and easier financial conditions; small caps lagging often signals caution or tight credit.
Sector mix
The Russell 2000 has a very different sector mix from the S&P 500. It contains many regional banks, biotechnology companies, industrial firms and consumer businesses, and far less of the large technology companies that dominate the S&P 500. That mix makes it more sensitive to US lending conditions, healthcare funding and domestic demand, and less to the fortunes of a few global technology giants.
Small caps under credit stress
When credit conditions tighten, small caps often feel it first. In March 2023, the failure of Silicon Valley Bank and the stress in regional banks hit the Russell 2000 harder than the S&P 500, because of its heavier weight in regional lenders and in companies that rely on bank credit.
Liquidity of members
Many Russell 2000 members trade far less than S&P 500 companies, with wider spreads and larger moves on news. For the index as a whole this matters less, but it explains why small-cap indices can move sharply on days when large flows hit a few hundred thinly traded shares.
A small-cap checklist
- What are interest rate expectations doing?
- Are credit conditions easing or tightening?
- Is the US economic outlook improving?
- How large is your position compared with the index’s typical daily range?
Common misreadings
- Assuming small caps always outperform over the long run.
- Sizing Russell 2000 positions like S&P 500 positions.
Through the economic cycle, illustrated
Imagine a recession ends and the central bank starts cutting rates. (Illustrative sequence.) In the following year, the Russell 2000 rises 30% while the S&P 500 gains 18%, as investors anticipate recovering earnings at smaller, more domestic companies. Later, as growth slows and rates stay high, the Russell 2000 lags, falling 15% in a year in which the S&P 500 is flat. Patterns like this are tendencies rather than rules, but they explain why the relative performance of the two indices is watched as an economic signal.
Mid caps in between
Between the S&P 500 and the Russell 2000 sit mid-sized companies, tracked by indices such as the S&P MidCap 400. They often combine some of the growth sensitivity of small caps with more established businesses and stronger balance sheets, and their performance tends to fall between the two. For traders, they are usually reached through funds rather than CFDs.
Reconstitution day
On the day the Russell indices are reconstituted, trading volumes in member shares can be among the highest of the year, concentrated in the closing auction. Prices of companies moving in or out of the index can swing sharply, and the index itself may see unusual moves near the close. Traders holding Russell 2000 positions around that date often reduce size or avoid orders in the closing auction to limit unexpected fills at distorted prices.
Frequently asked questions
Why do so many Russell 2000 companies lose money?
Because the index includes young and growing companies that are still investing heavily, as well as struggling ones. It has no profitability requirement for membership.
Are small caps a good diversifier for an S&P 500 position?
They are less concentrated and more tied to the domestic economy, so they behave differently at times, but they still fall with the market in broad sell-offs, often by more.
This article is educational content and does not constitute financial, investment, legal or tax advice. Digital assets are volatile and you may lose the amount you invest.
Sources
- Key learnings: US market indices (Russell 2000 small caps; S&P 500 large caps) — Vested Finance, 2026
- The evolution of S&P 500 top 10 companies (concentration near 40%; small caps relatively undervalued) — Landmark Wealth Management, 2026
- How the stock market performed in 2025 (S&P 500 +16.4%; Russell 2000 +11.3%; Dow record close 48,731 on December 24; Nasdaq Composite down about 21% at its April 8 low, then +52%) — ValueWalk, January 2026
- 2025 index returns and drawdowns (S&P 500 16%, max drawdown −19%, +37% since April 8 low; Russell 2000 11%, −24%, +41%) — Charles Schwab, December 2025