
S&P 500 vs Nasdaq 100: Why They Move Differently
The S&P 500 spans every sector; the Nasdaq 100 holds 100 non-financial firms, about 60% tech. Why their moves differ and why they have converged.
The S&P 500 vs Nasdaq 100 difference comes from what each holds. The S&P 500 covers about 500 large US companies in every sector, including banks and energy; the Nasdaq 100 holds 100 large non-financial Nasdaq firms and is about 60% tech. So the Nasdaq 100 usually swings more and reacts more to rates and tech earnings.
Side by side
| S&P 500 | Nasdaq 100 | |
|---|---|---|
| Members | About 500 | 100 |
| Sectors | All, including financials | Non-financial only |
| Technology weight | Close to 40% | About 60% |
| Weighting | Market cap | Modified market cap |
| Typical volatility | Lower | Higher |
| Rate sensitivity | Moderate | Higher |
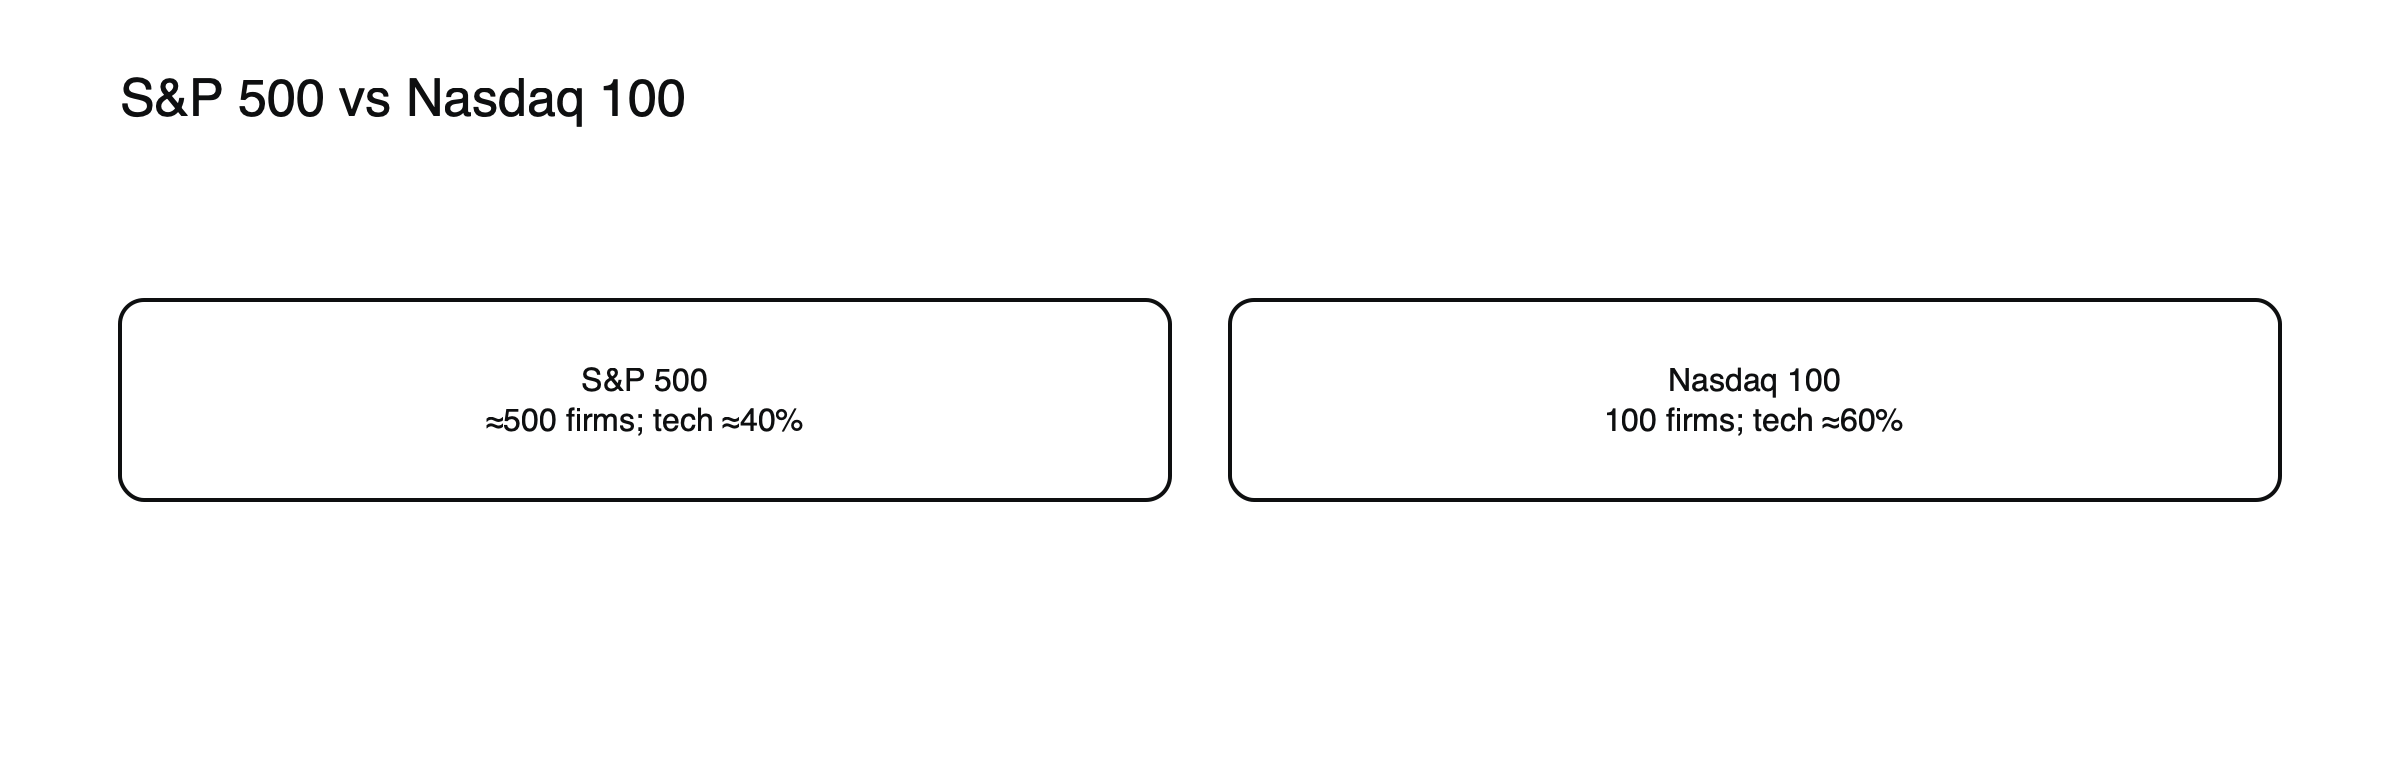
Figure: What each index holds.
2025 and the long run
In 2025, the S&P 500 rose about 16.4% and the Nasdaq 100 returned about 21.0%. Over the 18 years to 2025, the Nasdaq 100 outperformed in 14, and its total return since the end of 2007, about 1,342%, was more than double the S&P 500’s 560%. The other side of that record is deeper drawdowns: when technology falls out of favor, as in 2022, the Nasdaq 100 typically falls further.
Why they have converged
As technology giants grew, they came to dominate both indices. The 12-month correlation between them reached an all-time high of 0.98 in March 2026, so holding both is close to holding one bet twice.
When they diverge
- Rate shocks: in early 2022, the Nasdaq fell faster as yields rose.
- Sector rotations: when banks, energy or industrials lead, the S&P 500 outperforms.
- Tech earnings: a big miss from a mega-cap hits the Nasdaq 100 harder.
Sizing for the same risk
Because the Nasdaq 100 usually moves more, equal money in both is not equal risk. If the Nasdaq 100 tends to move 1.5 times as much as the S&P 500 on a typical day, a trader wanting the same daily risk might hold about two-thirds as much in the Nasdaq 100. For example, $15,000 of S&P 500 exposure and about $10,000 of Nasdaq 100 exposure would carry roughly similar daily swings. (Illustrative figures.)
Trading one against the other
Some traders take a view on technology relative to the broader market by buying one index and selling the other, for example buying the Nasdaq 100 and selling the S&P 500 when they expect falling yields to favor technology. Because the two are so closely correlated, such spread trades have much less market risk than a single position, but they depend on getting the relative move right and pay costs on both legs.
Which to trade when
The S&P 500 suits views on the US economy and market as a whole, with somewhat lower volatility. The Nasdaq 100 suits views on technology, growth and interest rates, with larger moves. Around a major technology company’s results, the Nasdaq 100 will usually react more; around bank results or oil shocks, the S&P 500 may move more relative to its usual range.
When diversification is less than it seems
«The S&P 500 is diversified» is less true today: its top 10 stocks reached a record 40.7% of the index in 2025.
See what the S&P 500 is , what the Nasdaq 100 is and how stock index CFDs work.
Holding both
With a correlation near 0.98, long positions in both indices behave almost like one larger position in either. A trader long $10,000 of each is effectively long about $20,000 of US large-cap technology-heavy equity. Adding up exposure across both, rather than treating them as separate bets, avoids taking on more risk than intended. See correlation mistakes that quietly double your forex risk for the same principle in currencies.
Sector differences
| Sector | S&P 500 | Nasdaq 100 |
|---|---|---|
| Technology | Largest sector, close to 40% | Dominant, about 60% |
| Financials | Significant | None by design |
| Energy and utilities | Present | Little or none |
| Healthcare | Significant | Smaller |
| Consumer and communication | Significant | Significant |
(General composition; weights change over time.) The absence of financials and energy from the Nasdaq 100 explains many of the days when the two indices move differently.
The same events, different reactions
| Event | S&P 500 | Nasdaq 100 |
|---|---|---|
| Bond yields jump | Falls | Usually falls more |
| Oil price spike | Energy cushions the fall | No energy cushion |
| Strong bank results | Lifted by financials | Little effect |
| Big technology earnings beat | Rises | Usually rises more |
Rebalancing differences
The S&P 500 is rebalanced quarterly by a committee that applies profitability and other rules; the Nasdaq 100 is reconstituted once a year in December, with quarterly weight reviews and occasional special rebalances when its largest members become too dominant. Membership and weight changes can therefore affect the two indices at different times. See how index rebalancing works.
Costs of trading each
CFDs on both indices are widely offered, usually with tight spreads during US hours. Because the Nasdaq 100’s level is higher, the same value per point represents a larger position, so traders often use smaller point values on it. Financing rates are usually similar.
Common misreadings
- Treating long positions in both indices as diversification.
- Assuming the Nasdaq 100 will always outperform.
A day of divergence, illustrated
Suppose bank shares rally on strong results and oil prices jump on supply news, while bond yields rise and technology shares slide. (Illustrative scenario.) The S&P 500 might finish flat, held up by financials and energy, while the Nasdaq 100, with neither sector to cushion it, falls 1.5%. A trader long both indices sees one position flat and the other losing, a reminder that despite their high correlation, the two can separate sharply on days when sector leadership shifts.
Watching the ratio
Dividing the Nasdaq 100 by the S&P 500 gives a ratio that rises when technology leads and falls when the broader market does. Over long periods, the ratio has trended upward as technology’s share of the economy grew, with sharp reversals in 2000–2002 and 2022. Watching it alongside bond yields shows how much of the market’s move is a technology story and how much a broader one, which helps decide which index best expresses a view.
The same companies, different weights
The largest technology companies are members of both indices, but they carry higher weights in the Nasdaq 100 because it has fewer members and no financials or energy companies. A strong report from one of them therefore lifts the Nasdaq 100 more than the S&P 500. Checking each company’s weight in both indices before its results shows which index is likely to react more. Weights shift as share prices change, so recent figures from the index providers usually give the most accurate picture before any large company report is released.
Frequently asked questions
Is the Nasdaq 100 just a technology index?
It is technology-heavy, about 60%, but also includes consumer, healthcare and industrial companies. It excludes financials.
Which index is safer?
Neither is safe in a leveraged position, but the S&P 500 is usually less volatile because it includes more sectors, such as financials, energy and utilities.
This article is educational content and does not constitute financial, investment, legal or tax advice. Digital assets are volatile and you may lose the amount you invest.
Sources
- What past sector concentrations tell us about today’s tech-heavy S&P 500 (IT near 40%; S&P 500–Nasdaq-100 correlation 0.98 in March 2026) — CME Group, 2026
- Key learnings: US market indices (S&P 500 tracks 503 large companies, about 80% of the US market; Dow 30 price-weighted; Nasdaq-100 largest non-financials, about 60% tech; Russell 2000 small caps; top 10 at 40.7%) — Vested Finance, 2026
- Stock market concentration statistics (top 10 a record 40.7% at end-2025; Magnificent Seven 34.3%; 17.8% in 2015) — Walnut, 2026
- When performance matters: Nasdaq-100 vs S&P 500, Q4 2025 (Nasdaq-100 21.0% in 2025; outperformed in 14 of 18 years; +1,342% vs +560% total return since 2007) — Nasdaq via ETF.com
- US stocks vs ASX shares in 2025 (S&P 500 +16.39% price, 17.88% total return, closed at 6,845.5; Nasdaq Composite +20.36%) — The Motley Fool Australia, January 2026