
How Circuit Breakers Work and When They Have Been Triggered
US circuit breakers halt trading when the S&P 500 falls 7%, 13% or 20% in a day. How they work and when they fired: once in 1997 and four times in 2020.
Circuit breakers are automatic halts that pause the whole US stock market when the S&P 500 falls sharply in a day: 15 minutes at 7%, another 15 at 13% and the rest of the day at 20%. They give investors time to absorb news in a panic. Since 1997, they have fired only four times, all in March 2020.
Why circuit breakers exist
On October 19, 1987, Black Monday, the Dow fell 508 points, or 22.6%, its largest one-day percentage drop. Selling overwhelmed exchanges, and computerized portfolio insurance strategies added to the pressure. Regulators concluded that markets needed a way to pause during extreme falls, and the first market-wide circuit breakers were introduced in the following years. See what happened on Black Monday 1987.
The three levels
| Level | S&P 500 decline | Halt |
|---|---|---|
| Level 1 | 7% | 15 minutes (only before 3:25 p.m. ET) |
| Level 2 | 13% | 15 minutes (only before 3:25 p.m. ET) |
| Level 3 | 20% | Rest of the day |
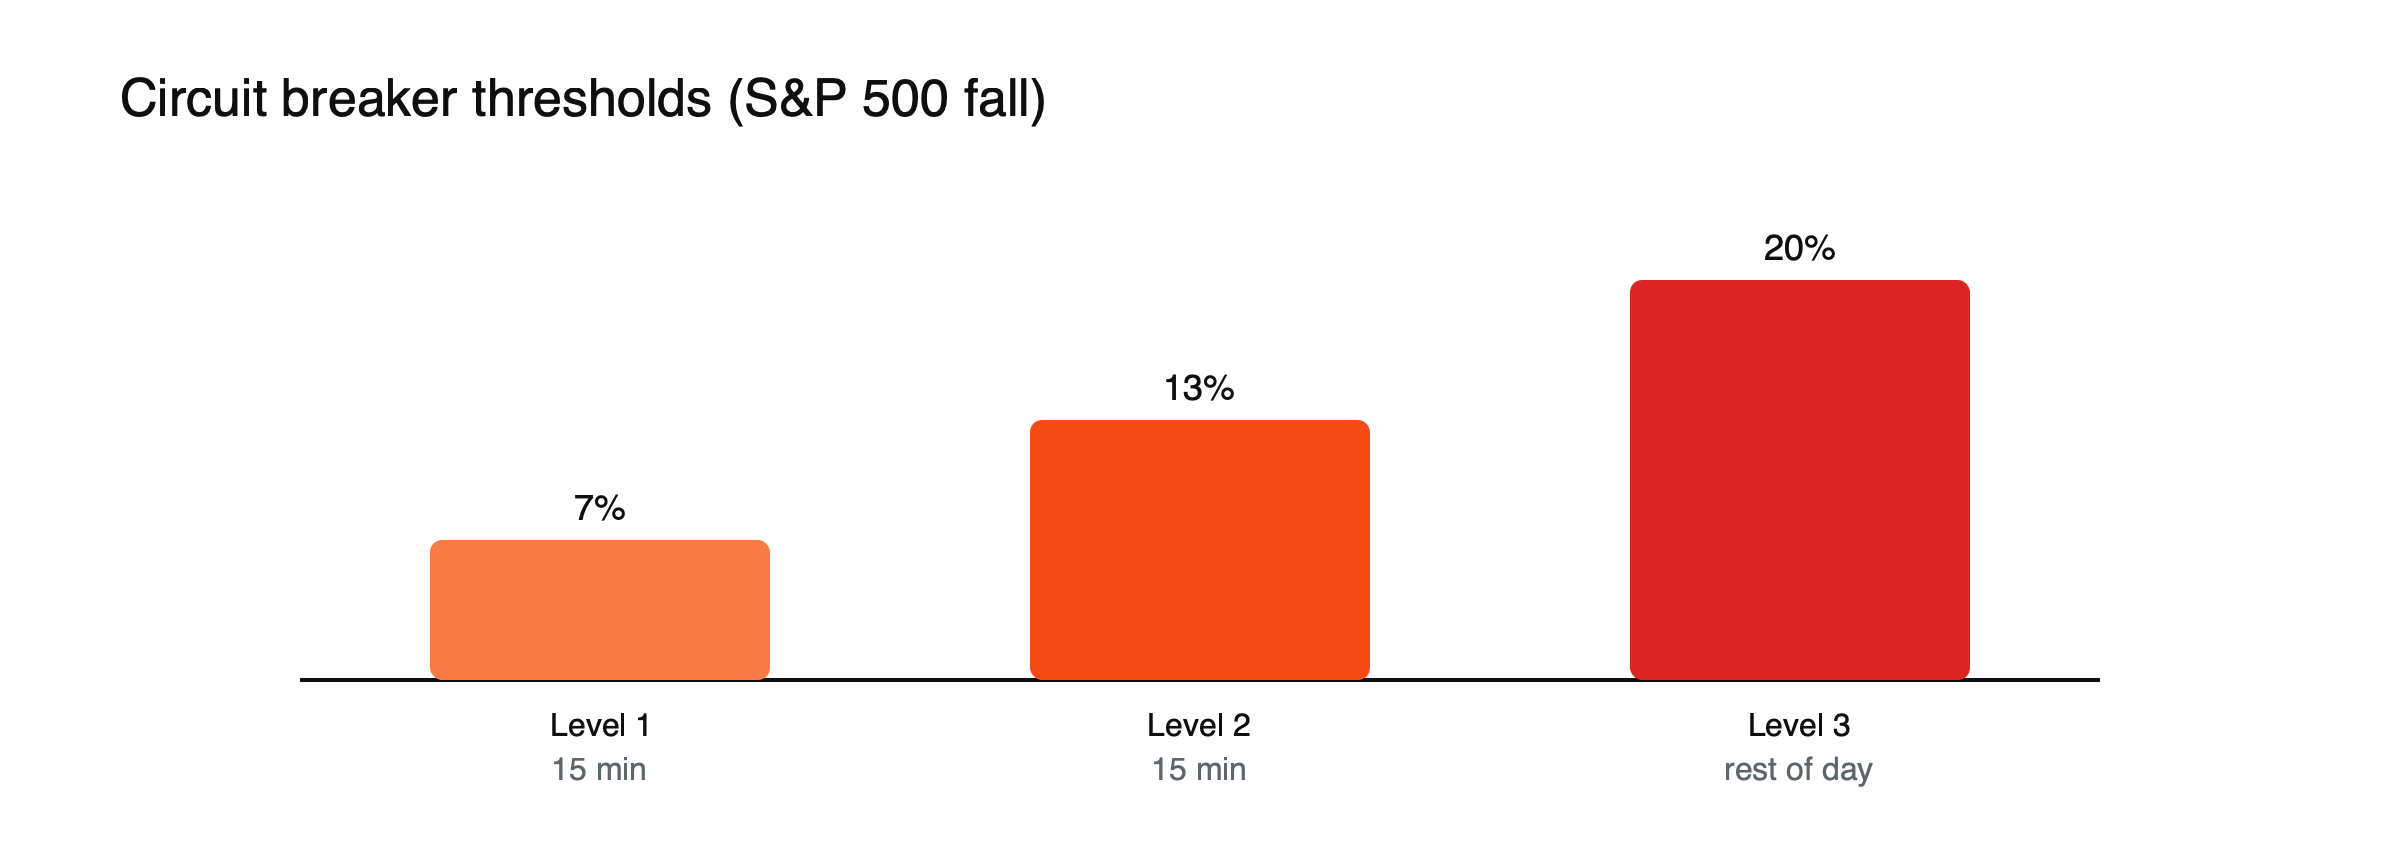
Figure: Market-wide circuit breaker levels.
Timeline
- October 27, 1997: the Dow falls 7.18%, triggering the first market-wide halt and an early close.
- 2012: the SEC approves limit up–limit down bands for individual stocks.
- March 9, 2020: the S&P 500 drops 7% minutes after the open; first Level 1 halt in over 20 years.
- March 12 and 16, 2020: Level 1 halts near the open again; on March 16 the market kept falling to about 12% after trading resumed.
- March 18, 2020: a Level 1 halt shortly before 1 p.m.
No Level 2 halt has occurred under the current framework.
The 2010 flash crash
On May 6, 2010, US share prices plunged and rebounded within minutes, with the Dow falling about 1,000 points before recovering most of the loss. A large sell program of about $4.1 billion in futures interacted with high-frequency trading to drain liquidity, and some stocks briefly traded at absurd prices. Nearly 21,000 trades were later canceled. The episode led regulators to adopt single-stock limit up–limit down bands and to revise the market-wide circuit breakers. See what happened in the 2010 flash crash.
March 2020, illustrated
Suppose the S&P 500 closed at 2,900 the previous day. (Illustrative figures.) A Level 1 halt would trigger at about 2,697, a 7% fall, and a Level 2 halt at about 2,523, a 13% fall. On several days in March 2020, the index fell 7% within minutes of the open, pausing trading for 15 minutes. On March 16, after the pause, selling resumed and the index closed down about 12%, close to the Level 2 threshold but not reaching it.
Do they work?
Supporters say they interrupt panic and let liquidity return. Critics note they can encourage selling as markets approach the threshold. In 2020, three of the four halts were followed by stabilization near the 7% level.
Single-stock pauses
Individual stocks have separate limit up–limit down bands that trigger five-minute pauses. See why exchanges halt trading in a stock, how 24/7 trading is changing market structure and how the 2020 pandemic crash hit every asset class.
China’s brief experiment
China introduced a market-wide circuit breaker at the start of 2016, halting trading for 15 minutes on a 5% fall and for the day on a 7% fall. The mechanism was tripped twice in its first week, on January 4 and January 7, and regulators suspended it from January 8. Critics argued that the thresholds were too close together and that investors rushed to sell before trading could be halted, a “magnet effect” that made falls worse.
Circuit breakers and other markets
Market-wide halts apply to US stock exchanges, but futures markets have their own price limits, and other assets continue trading. During a share market halt, index futures, currencies and crypto may keep moving, so investors can see where prices might reopen. CFDs on share indices may be suspended or may track futures prices, depending on the provider.
What traders should know
Halts do not stop losses; they delay trading. Positions cannot be closed during a halt, and prices can reopen far from where they stopped. Stop orders triggered at the reopen may fill at worse levels. Using lower leverage and guaranteed stops, where offered, reduces the risk of large unexpected losses during extreme days.
The timing rules
Level 1 and Level 2 halts can only occur before 3:25 p.m. Eastern Time. A 7% or 13% fall after that time does not stop trading, because regulators want the market to close normally and set closing prices. A Level 3 fall of 20% halts trading for the rest of the day at any time. Each level can only be triggered once a day.
Market-wide versus single-stock
| Market-wide circuit breakers | Limit up–limit down | |
|---|---|---|
| Trigger | S&P 500 falls 7%, 13% or 20% | Single stock moves outside its price band |
| Scope | All US stocks | One stock |
| Pause | 15 minutes, or rest of day | Usually 5 minutes |
| Frequency | Rare (four times since 1997) | Several times a day |
The magnet effect
Critics argue that circuit breakers can attract prices toward their thresholds, as investors rush to sell before trading stops. China’s experience in January 2016, when halts triggered twice in a week, is often cited as evidence. US thresholds are set further apart, which may reduce the effect.
Other countries
Many exchanges use their own mechanisms, from market-wide halts to daily price limits on individual stocks and index futures. The details vary widely, which matters for traders holding positions across markets.
Common misreadings
- Believing halts prevent further losses.
- Assuming circuit breakers apply to rising markets.
What a halt day looks like
On March 9, 2020, the S&P 500 fell 7% within minutes of the open, triggering the first market-wide halt in over 20 years. For 15 minutes, no shares traded on US exchanges, while futures and other markets continued to move. When trading resumed, prices swung sharply as orders that had built up during the pause were executed. Similar scenes played out on March 12, 16 and 18. Traders described the halts as a brief pause that did little to change the direction of the day, but that may have reduced disorderly trading in the opening minutes.
Circuit breakers and volatility
Days when circuit breakers trigger usually coincide with extreme volatility readings. The VIX closed at a record 82.69 on March 16, 2020, one of the days a halt occurred. Such readings signal that option traders expect very large moves, the conditions under which circuit breakers are most likely to be tested. See what the VIX is.
Circuit breakers and CFDs
When US exchanges halt, CFDs on US shares are usually suspended, while index CFDs may follow futures prices if those keep trading, depending on the provider. Traders can therefore see prices move on index CFDs during a halt but be unable to trade individual share CFDs. Checking a provider’s policy for market-wide halts is worthwhile before trading through volatile periods.
Lessons from four halts
The March 2020 halts taught several lessons. They did not stop markets from falling further on some days, but they gave investors a short pause in the most chaotic moments. They were followed by a strong recovery once central banks and governments acted. And they showed that even rare safeguards can trigger several times in a week when conditions are extreme. Traders using leverage were most exposed to the sharp moves around each halt.
Why thresholds use the prior close
The 7%, 13% and 20% levels are calculated from the S&P 500’s previous closing value, published before each trading day. Traders can therefore know in advance exactly where each halt would trigger, which some use to plan risk on volatile days. Index futures traders watch the levels, because a halt in shares can change how futures trade during the pause.
Frequently asked questions
Have circuit breakers ever closed the US market for a whole day?
Not under the current framework; the last full-day closure from a market-wide halt was in 1997.
Do circuit breakers apply to single stocks?
Single stocks have separate limit up–limit down pauses, which are much more common.
This article is educational content and does not constitute financial, investment, legal or tax advice. Digital assets are volatile and you may lose the amount you invest.
Sources
- Stock market circuit breakers (levels; March 2020 halts were the first in nearly 20 years) — Schwab
- What are circuit breakers? (October 27, 1997 first trigger; Dow −7.18%; LULD approved in 2012) — Moomoo
- What is a circuit breaker? (March 2020 trigger times; no Level 2 since the 2013 framework; 3:25 p.m. rule) — Tapeboard
- Circuit breakers: emergency brakes for the stock market (three of four 2020 halts stabilized; March 16 fell nearly twice as far) — Motley Fool, 2022
- Lessons from Black Monday (Dow −508 points, −22.6%; circuit breakers introduced; 2010 flash crash) — The Globe and Mail
- Regulators release flash crash probe report ($4.1 billion sell program; nearly 21,000 trades canceled) — PlanAdviser / AP
- China suspends market circuit breaker after stock rout (15-minute halt at 5%, full-day halt at 7%; tripped twice in its first week; suspended from January 8, 2016) — Reuters via Fortune, January 2016
- The fear gauge: what the VIX tells us (record close 82.69 on March 16, 2020) — Datahub