
Why Volatility in One Market Spills Into Others
A shock in one market can spread to others through leverage, forced selling and shared investors. How spillovers worked in 2008, March 2020 and August 2024.
Volatility spillover happens when a shock in one market forces investors to sell elsewhere. Leverage, margin calls and shared holders link markets that normally move separately. On August 5, 2024, a rapid unwind of yen-funded trades sent Japan’s Nikkei down 12.4% in a day, its worst since 1987, and dragged European stocks and bitcoin lower too.
How spillovers happen
- Leverage and margin: losses in one position force sales of others to raise cash.
- Shared investors: funds that own stocks, bonds and crypto sell all of them when they cut risk.
- Funding currencies: when a cheap funding currency rises, trades financed with it are closed everywhere at once. See why the yen rallies when global markets sell off.
- Liquidity: in a rush for cash, even safe assets can be sold.
A spillover chain, illustrated
Suppose a hedge fund borrows yen to buy US technology shares and bitcoin. (Illustrative scenario.) The yen rises 8% in a week, increasing the fund’s debt in dollar terms, while its shares fall 10%. Its lenders demand more collateral. To raise cash, it sells technology shares, bitcoin and even some gold. Those sales push prices down, hitting other investors holding similar positions, who must also sell. A currency move in Tokyo becomes a sell-off in New York and in crypto within hours.
Three examples
2008. As the financial crisis spread, correlations between many asset classes rose sharply, and diversification across them did little to protect portfolios.
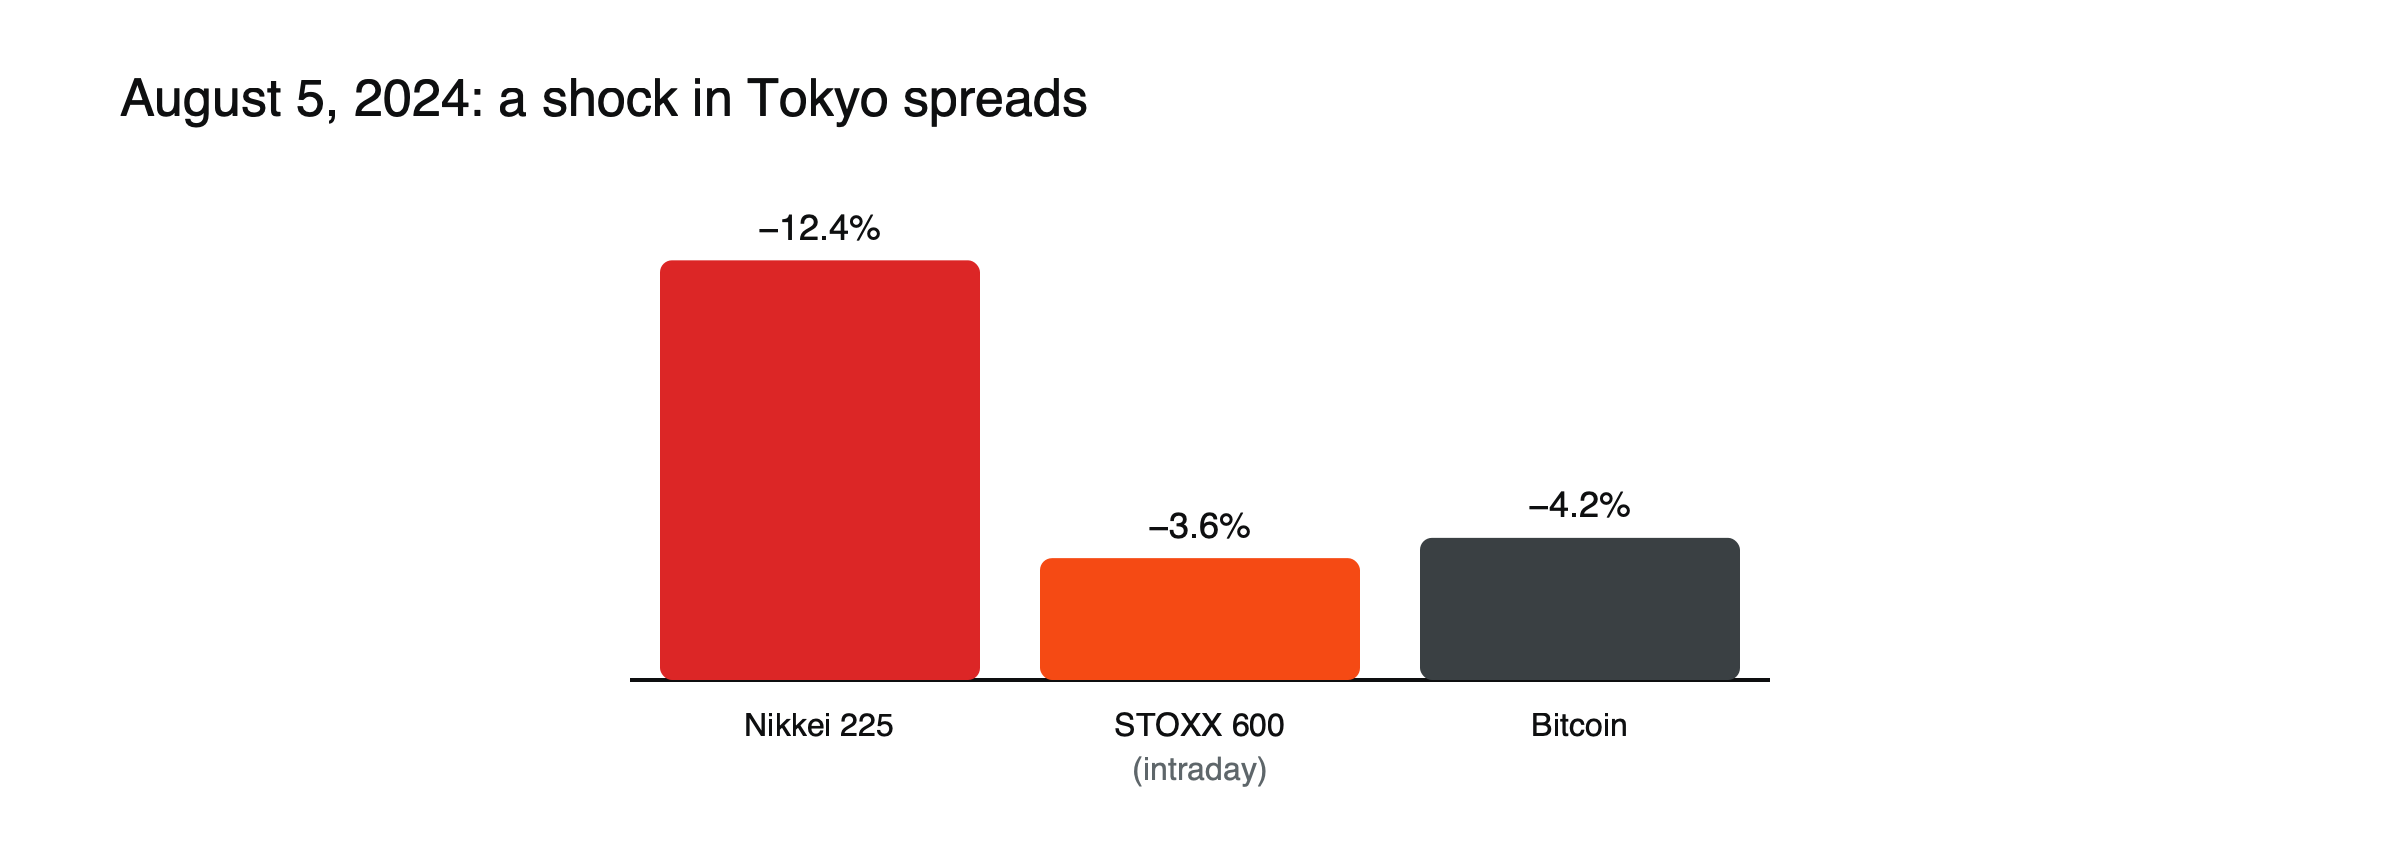
Figure: One shock, three markets. Source: Money by CJ.
March 2020. In a dash for cash, bitcoin’s correlation with stocks jumped, and even gold, usually a haven, fell. Some bond funds traded well below the value of their holdings.
August 2024. The yen rose about 14% against the dollar in less than a month. The Nikkei fell 12.4% on August 5, Europe’s STOXX 600 fell as much as 3.6% and bitcoin dropped further after earlier losses.
April 2025. As tariff announcements escalated, the S&P 500 fell about 12% in four days. Volatility spread to bonds, currencies and commodities, before a tariff pause on April 9 sparked a rally of about 9.5% in one day.
October 10, 2025. A sharp crypto sell-off erased more than $19 billion in leveraged positions in a single day, as liquidations on one platform triggered falls and further liquidations on others.
How fast spillovers reverse
Forced selling usually ends once leveraged positions are cleared, and prices can rebound sharply. On August 6, 2024, the day after its 12.4% fall, the Nikkei rose about 10.2%, its biggest one-day gain on record. Those who were forced to sell at the bottom missed the rebound, which is why avoiding forced selling matters more than predicting the shock.
How to read the risk
Spillovers are most likely when positioning is crowded and leverage is high. Watch funding currencies, credit spreads and volatility measures together. See what credit spreads tell equity traders.
Limits
Many spillovers reverse quickly once forced selling ends; markets rebounded the day after August 5, 2024. See why correlations go to one in a crisis and what causes liquidation cascades.
Volatility as a contagion channel
Many funds size their positions according to recent volatility: when volatility rises, they cut exposure automatically. A jump in volatility in one market therefore forces selling by these funds across all the markets they hold, even those that have not moved. Risk-parity funds, volatility-targeting strategies and some trend-following funds behave this way, amplifying spillovers when volatility spikes. See what the VIX is.
Crypto as a spillover channel
Crypto trades around the clock, so it is often the first market to react to weekend or overnight news, and leveraged crypto positions can be liquidated in minutes. Large crypto liquidations can spill into shares of crypto-related companies and, through shared investors, into technology shares. See what causes liquidation cascades.
Signs of spillover risk
- Crowded positions in a single trade, such as a funding currency
- Volatility unusually low for a long period, encouraging leverage
- Rising margin requirements or funding costs
- Sudden moves in a currency or market many investors use for funding
Protecting against spillovers
Keeping leverage moderate, holding some cash, avoiding crowded trades and sizing positions for sudden gaps all reduce exposure. Diversifying across assets helps over time, but in the worst hours of a spillover, the best protection is not being forced to sell.
Measuring spillover
Researchers measure spillover by how much of the volatility in one market can be explained by shocks in others. In calm periods, most of a market’s volatility comes from its own news; in crises, a large share comes from shocks elsewhere. Traders use simpler signs: volatility indices in several markets rising together, and correlations jumping across assets that usually move independently.
From bonds to everything
Bond markets can be the source of spillovers too. In the 2013 taper tantrum, a jump in US yields hit emerging market currencies, gold and long bonds worldwide. In the 2022 UK gilt crisis, a sudden rise in gilt yields forced pension funds to sell assets and sent the pound to a record low. See what happened in the UK gilt crisis.
From one country to many
Shocks in large economies spread through trade, banks and investors. Problems in one emerging market can lead investors to sell others with similar weaknesses, even if their own conditions have not changed, a pattern seen repeatedly in emerging market crises.
Weekends and gaps
Crypto reacts to news over weekends while most other markets are closed. A large weekend move can signal how other markets may open on Monday, creating gaps in currencies, share index futures and commodities. Traders holding positions over weekends face that gap risk.
Common misreadings
- Treating diversification as protection in a spillover.
- Assuming quiet markets mean low risk.
Central banks as circuit breakers
Central banks often step in when spillovers threaten the financial system. In March 2020, the Federal Reserve’s massive support stopped the dash for cash; in September 2022, the Bank of England’s gilt purchases ended the doom loop in UK pensions; in August 2024, the Bank of Japan’s reassurance helped markets rebound. Expectations of such support can limit spillovers, though they may also encourage the leverage that causes them.
Volatility clusters
Volatile days tend to follow volatile days, and calm periods tend to persist. After a spillover, volatility usually stays elevated for weeks even if prices recover quickly, which is why traders often keep positions smaller for some time after a shock.
A spillover timeline, illustrated
Suppose a surprise policy change in one country triggers a sharp currency move overnight. (Illustrative scenario.) In the first hour, leveraged currency positions are closed. Within a few hours, share index futures in other regions fall as funds cut risk. By the next morning, crypto has dropped and volatility indices have jumped. Over the following days, central banks or officials reassure markets, forced selling ends and prices partly recover. The sequence repeats across many episodes, though the trigger differs each time.
Crowded trades
The most damaging spillovers come from trades that many investors hold at once, such as borrowing in a low-yielding currency to buy higher-yielding assets, or betting on continued low volatility. When the trade turns, everyone tries to exit together, and the selling spreads to whatever else those investors own. Spotting crowded trades, through positioning data, popular narratives and unusually low volatility, is one of the best ways to anticipate where a spillover could start.
Lessons for individual traders
Individual traders rarely cause spillovers, but they feel them. Holding positions in several markets that share a common risk, such as technology shares, crypto and high-yield currencies, can mean losing on all of them at once. Reducing leverage when volatility is unusually low, keeping stops and position sizes realistic for gaps, and avoiding the most crowded trades all help. After a spillover, waiting for volatility to settle before rebuilding positions can avoid being caught by aftershocks, which often follow the first wave of selling. The second wave is often smaller, but it can still catch traders who rushed back in too early with full leverage.
Frequently asked questions
Are spillovers becoming more common?
Markets are more connected than ever, through shared investors, around-the-clock crypto trading and automated strategies, which makes rapid spillovers easier.
Does a spillover always mean a crisis?
No. Many, like August 2024, reverse within days once forced selling ends.
This article is educational content and does not constitute financial, investment, legal or tax advice. Digital assets are volatile and you may lose the amount you invest.
Sources
- The Yen Carry Trade that Crashed the Markets in August 2024 (Nikkei −12.4%, worst since 1987; STOXX 600 down as much as 3.6%; bitcoin fell) — Money by CJ
- Carry Trade Unwind: Is It Really Over? (yen up 14% against the dollar July 10 to August 5; rebound the next day) — Schwab via Advisor Perspectives
- VIX futures and options (correlations between asset classes rose in 2007–2008) — ASX / UMass research paper
- Bitcoin vs equities (correlations increased in the mid-March 2020 flight to cash; gold affected too) — Xetra research note, June 2020
- 14 weeks and 12 numbers (bond ETF traded at a 6.2% discount to NAV on March 12, 2020) — Monevator
- How the stock market made back all its losses after the trade war escalated (S&P 500 −12% in four days; April 9 pause, +9.5%) — AP via Fortune, May 2025
- DeFi TVL drops 39% in 2026 (October 10, 2025 crash erased more than $19 billion of leveraged positions) — Cointelegraph, June 2026
- Bank of Japan reassures markets (Nikkei +10.2% on August 6, 2024) — FinanzaOnline, August 7, 2024