
What Happens to Markets When the Yield Curve Un-Inverts?
Recessions have often started after the yield curve un-inverted, not during inversion. The record since 1976, the 2024 exception and what it means.
Yield curve un-inversion is when long-term yields move back above short-term yields after a period of inversion. Historically, recessions have often begun after the un-inversion rather than during the inversion: the curve un-inverted before the 1990, 2001, 2007 and 2020 recessions. The record 26-month inversion that ended in 2024 has so far been the exception, with no recession following.
The record since 1976
- 1980: un-inversion came with a recession already underway.
- 1982: un-inversion opened an eight-year expansion.
- 1989: recession from July 1990.
- 2000: recession from March 2001.
- 2007: recession from December 2007.
- 2019: recession from February 2020, triggered by the pandemic.
- August–September 2024: un-inversion after 26 months; no recession as of 2026.
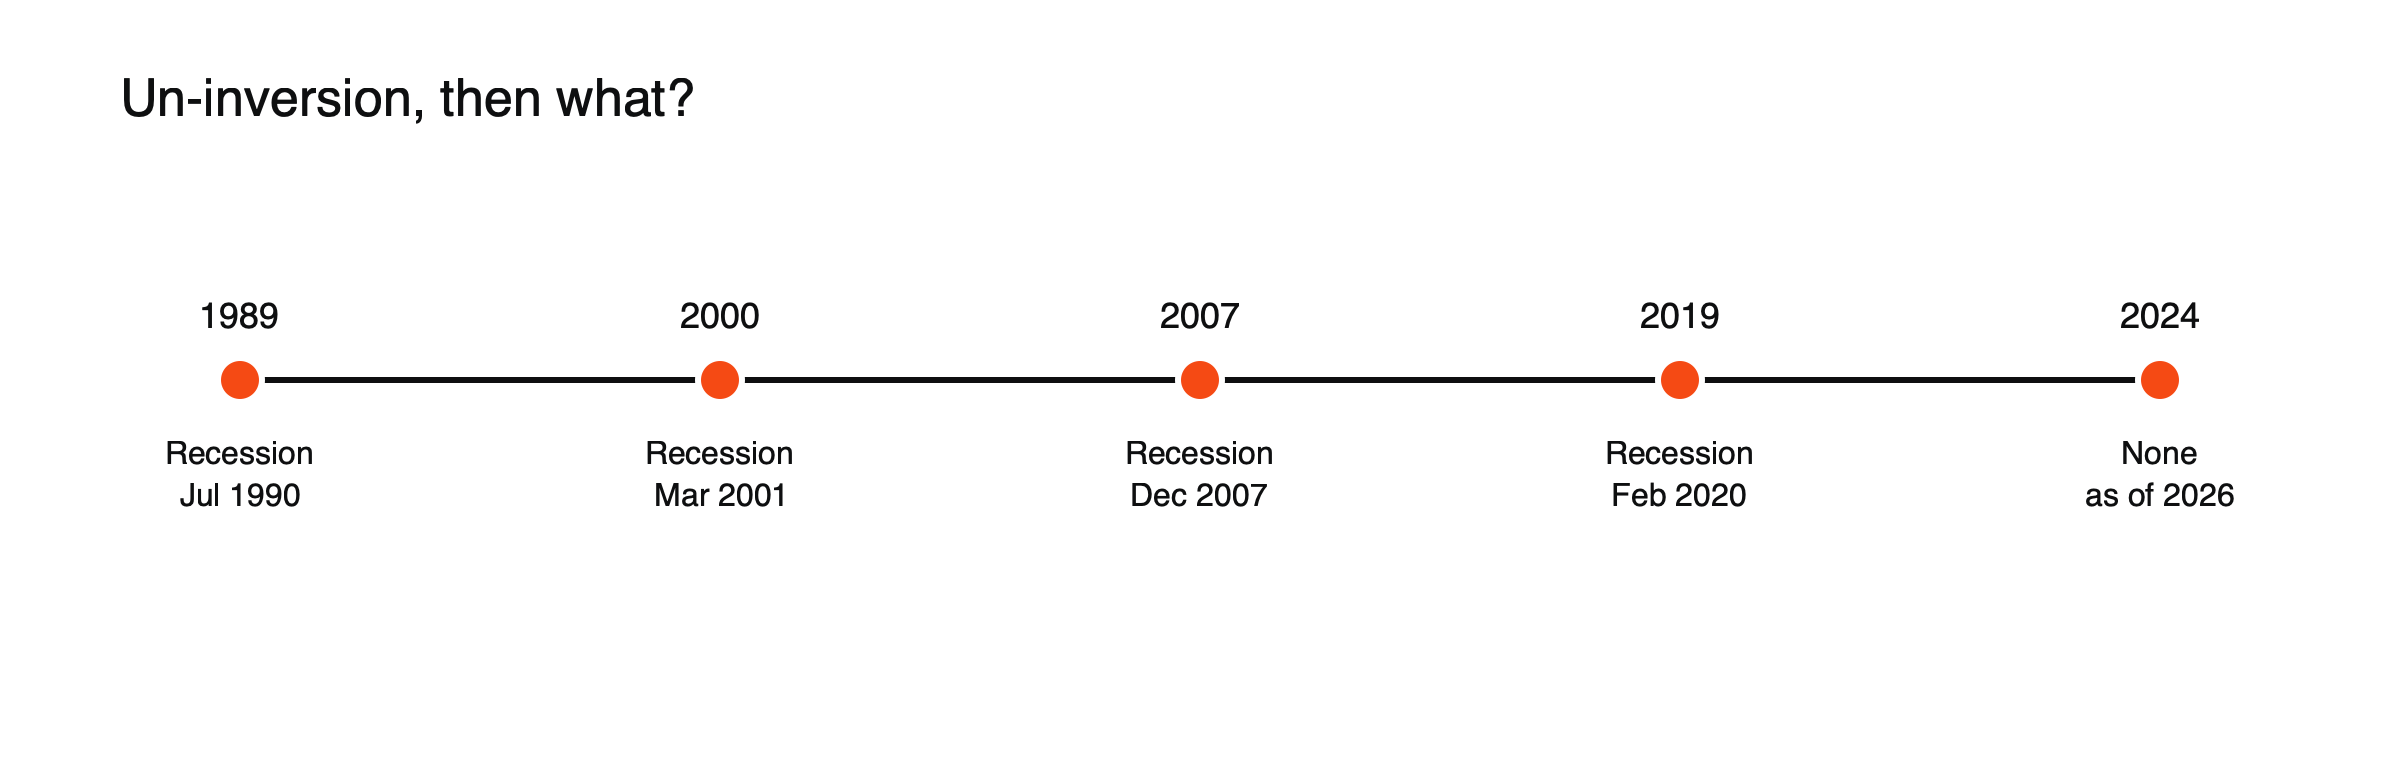
Figure: Un-inversions and the recessions that followed. Source: MarketCrash.net.
Bull and bear un-inversions
Not all un-inversions are alike. In a bull un-inversion, short-term yields fall faster than long-term yields, usually because the central bank is cutting or is expected to cut soon. In a bear un-inversion, long-term yields rise faster, perhaps because of inflation or borrowing worries. Historically, the bull version, driven by cuts in response to weakness, has been the stronger recession warning. See why yield curve steepening can mean very different things.
Why un-inversion has been a warning
The curve usually un-inverts because the central bank starts cutting short-term rates in response to weakening growth. By then, the slowdown may already be underway.
What markets did
The lag from un-inversion to recession has ranged from about three months to over a year, and stocks did not fall uniformly in those windows; they often rallied after the first inversion.
An un-inversion, illustrated
Suppose the 2-year yield is 4.8% and the 10-year 4.3%, an inversion of −0.5 points. (Illustrative figures.) Over six months, the central bank begins cutting and the 2-year falls to 3.9%, while the 10-year slips to 4.1%. The curve moves from −0.5 to +0.2 points: a bull un-inversion. Bonds gain, especially short-dated ones, and markets begin asking whether the cuts are a response to a slowdown that will deepen or a normalization after inflation has eased. The answer decides how shares behave next.
The 2022–2024 episode
The 2-year/10-year curve inverted in July 2022 as the Fed raised rates rapidly, reached its deepest point of about −1.08 points in July 2023 and un-inverted in August and September 2024 as the Fed prepared to cut and then cut by half a point. The 26-month inversion was the longest on record. Shares rose strongly through much of it and after the un-inversion, and as of 2026, no recession had followed.
Why 2024 may differ
The 2022–2024 inversion was driven by aggressive rate hikes to fight inflation, while the economy stayed resilient. Some analysts argue years of central bank bond buying distorted long-term yields, weakening the signal. Others note the post-un-inversion window has not fully passed.
How to use it
Treat un-inversion as a reason to check other signals, such as credit spreads and the labor market. See how recession signals have performed historically, what credit spreads tell equity traders and why yield curve steepening can mean very different things.
What shares did around past un-inversions
Share market behavior varied widely. Before the 2001 and 2007 recessions, shares fell substantially in the months after un-inversion, as profits declined. After the 1982 un-inversion, shares began a long bull market. In 2019, shares rose until the pandemic shock of early 2020. The lesson is that un-inversion signals a change in the policy cycle, but the economy’s direction decides what follows for shares. See how stocks have behaved in past rate-cutting cycles.
Other assets
Government bonds have usually gained around un-inversions, as cuts lower short-term yields. Gold has often risen as real yields fall. The dollar has tended to weaken when the Fed cuts faster than other central banks. Credit spreads have widened before past recessions but stayed tight in 2024.
A checklist after un-inversion
- Is the un-inversion led by falling short yields or rising long yields?
- Are credit spreads widening?
- Is unemployment rising quickly?
- Are earnings forecasts being cut?
The 3-month/10-year measure
Some economists prefer the gap between the 3-month Treasury bill and the 10-year note, which reflects the current policy rate more directly than the 2-year yield. It often inverts and un-inverts at different times from the 2-year/10-year curve. Watching both gives a fuller picture, and when both un-invert together, the signal of a change in the policy cycle is clearer.
Un-inversion and banks
A steeper curve after un-inversion usually improves banks’ lending margins, as they borrow short and lend long. Bank shares often benefit, unless rising loan losses from a slowdown offset the gain. In 2024, bank shares generally rose as the curve steepened and credit losses stayed contained.
Un-inversion and the dollar
When un-inversion is driven by expected Fed cuts, the dollar often weakens, as US short-term rates fall relative to other countries’. If other central banks are cutting faster, the effect can be muted. See what happens to currencies when a central bank pivots.
Un-inversion abroad
Curves in the UK, Germany and other countries also inverted in 2022 and 2023 and later un-inverted as their central banks cut. Their records as recession signals are less studied, but the same logic applies: un-inversion led by cuts in response to weakness is a stronger warning than one led by rising long-term yields.
Common misreadings
- Treating un-inversion as an all-clear.
- Selling everything as soon as the curve turns positive.
Why some economists discount the signal
Critics argue that years of central bank bond buying lowered long-term yields artificially, making inversions more likely without signaling recession, and that strong household and corporate finances made the economy less sensitive to higher short-term rates. Others note that inversions driven by inflation-fighting hikes may carry a different message from those driven by fears of weak demand. These debates explain why the 2024 un-inversion did not trigger the alarm it might have in earlier cycles.
Trading after un-inversion
Traders often use un-inversion as a prompt to review exposure to cyclical assets and to consider positions that benefit from further steepening, such as holding short-dated bonds over long-dated ones. Because the lag to any recession is long and variable, many prefer gradual adjustments over dramatic moves. See how recession signals have performed historically.
Un-inversion and gold
Gold has often risen around un-inversions, as falling short-term rates reduce real yields and the opportunity cost of holding it. In 2024, gold rose to records around the time of the Fed’s first cut. See what usually happens to gold when the Fed starts cutting.
Lessons from 2024
The 2024 episode taught three lessons. First, the cause of the inversion matters: hikes to fight inflation in a strong economy may not end in recession. Second, other signals, such as credit spreads and jobless claims, can provide a reality check. Third, staying invested through a long inversion was rewarded, while selling early proved costly. None of these lessons means the signal is useless, only that it needs context.
Past un-inversions at a glance
| Un-inversion | What followed |
|---|---|
| 1982 | Long expansion |
| 1989 | Recession from July 1990 |
| 2000 | Recession from March 2001 |
| 2007 | Recession from December 2007 |
| 2019 | Pandemic recession from February 2020 |
| 2024 | No recession as of 2026 |
How long the window lasts
In past cycles, the time from un-inversion to the start of a recession ranged from about three months to more than a year, and shares often peaked somewhere in between. That wide range makes un-inversion a poor timing tool even when it does precede a downturn. By late 2026, two years had passed since the 2024 un-inversion without a recession, already longer than in most past cycles, which suggests either that the signal failed this time or that the economy’s response to policy has changed.
What to watch next
If a recession were approaching, the usual confirming signs would be widening credit spreads, rising jobless claims, falling earnings forecasts and faster rate cuts. Their absence is itself information. It also means the signal deserves continued monitoring rather than simple dismissal.
Frequently asked questions
Is un-inversion more important than inversion?
Historically, recessions have often begun after un-inversion, so many analysts watch it closely, but neither is a reliable timer.
How long after un-inversion have recessions started?
From about three months to over a year in past cycles, with none following the 2024 un-inversion as of 2026.
This article is educational content and does not constitute financial, investment, legal or tax advice. Digital assets are volatile and you may lose the amount you invest.
Sources
- What Happened After the Yield Curve Un-inverted? (each un-inversion since 1976 and what followed; September 2024 after 26 months; lag of three months to over a year) — MarketCrash.net
- 2s10s Yield Curve Inversion History (26-month 2022–2024 inversion not followed by recession as of 2026) — Eco3min
- What is an inverted yield curve? (stocks often rally after inversion; QE distortion debate) — Tapeboard
- The Yield Curve Manual (deepest inversion −1.08 points in July 2023) — TheTrading.Tools