
Carry Trade Mistakes That Hurt in a Risk-Off Move
Five carry trade risks, stress-tested on one position: central bank turns, risk-off weeks, crowded exits, slow grinds and doubled leverage in action.
Carry trade risks are easy to underestimate because the income arrives steadily while the danger arrives all at once. The costliest mistakes are ignoring exchange-rate risk, leveraging a small yield, crowding into the same trade, missing central bank shifts and holding through panics. A simple stress test shows how each one plays out.
The position being tested
Each scenario below applies to the same illustrative position, so the effects can be compared. A trader with a $10,000 account buys 1 standard lot of USD/JPY at 150.00, about $100,000 of exposure, to earn the interest gap between the dollar and the yen. After the broker’s fee, the position earns about 3.5% a year, roughly $9.59 a night. Effective leverage is about 10 to 1. Nothing about the position is unusual; this is how many carry trades look in calm markets. (All figures are illustrative.)
Scenario 1: the funding currency’s central bank turns
The Bank of Japan signals a series of rate rises, and over two weeks USD/JPY falls 5%, to about 142.50. The position loses about $5,260, more than half the account. Over the same fortnight, it earns about $134 in carry. The mistake is ignoring central bank shifts: carry trades depend on a rate gap that one meeting can start to close, as Japan’s rate rise in July 2024 showed. The fix is to follow both central banks’ guidance and reduce positions when the funding currency’s bank starts sounding hawkish. See how central bank decisions move currencies.
Scenario 2: a global risk-off week
A sudden sell-off in stocks sends investors back to the yen, and USD/JPY drops 8% in a week, to about 138. The position loses about $8,700 while earning about $67 of carry. The mistake is holding through panics: the yen tends to rise exactly when risk appetite falls, so the carry trade loses precisely when the rest of a portfolio does. The fix is to treat rising volatility, falling stock markets and widening credit spreads as signals to cut carry exposure early, rather than waiting for the exchange rate to confirm the danger. See risk-on vs risk-off.
Scenario 3: the crowded exit
Now suppose the same 8% move happens because thousands of traders hold the same position and all try to close it together. Prices gap through levels where stops were placed, and spreads widen sharply. A stop set 3% below entry fills 6% below instead. The mistake is crowding in: popular carry trades feel safer because everyone holds them, but the crowd is what turns an orderly decline into a rush for the exit. The fix is to treat widely discussed carry trades as more fragile, not less, and to size them for gaps rather than for the stop distance alone.
Scenario 4: the slow grind
Not every carry loss is dramatic. Over a calm year, the position earns about $3,500 in carry, but USD/JPY drifts 4% lower in small steps. The currency loss of about $4,000 more than cancels the income. The mistake is ignoring exchange-rate risk: a 3.5% yield offers little protection against a pair that can move 10% or more in a year. The fix is to compare the expected carry with the pair’s typical annual movement before entering; a ratio well below one means the income is a small cushion against much larger swings. See what the carry trade is.
Scenario 5: the same week with double the size
Repeat scenario 2, but with 2 lots instead of 1, effective leverage of about 20 to 1. The 8% move now costs about $17,400, far more than the $10,000 account. In practice, a margin call and stop-out would close the position well before the bottom, crystallizing a loss of most of the account. The mistake is leveraging a small yield: doubling size doubles the carry, from about $3,500 to $7,000 a year, but it also doubles the damage from every adverse move. The fix is to size by the worst plausible move, not by the income. See how leverage changes the math on a forex trade.
The stress test in one table
| Scenario | Exchange-rate loss | Carry earned meanwhile | Mistake exposed |
|---|---|---|---|
| Funding central bank turns | About $5,260 | About $134 | Ignoring central bank shifts |
| Risk-off week | About $8,700 | About $67 | Holding through panics |
| Crowded exit | Stop fills twice as far away | Negligible | Crowding in |
| Slow grind | About $4,000 | About $3,500 | Ignoring exchange-rate risk |
| Double size | Account wiped out | About $67 | Leveraging a small yield |
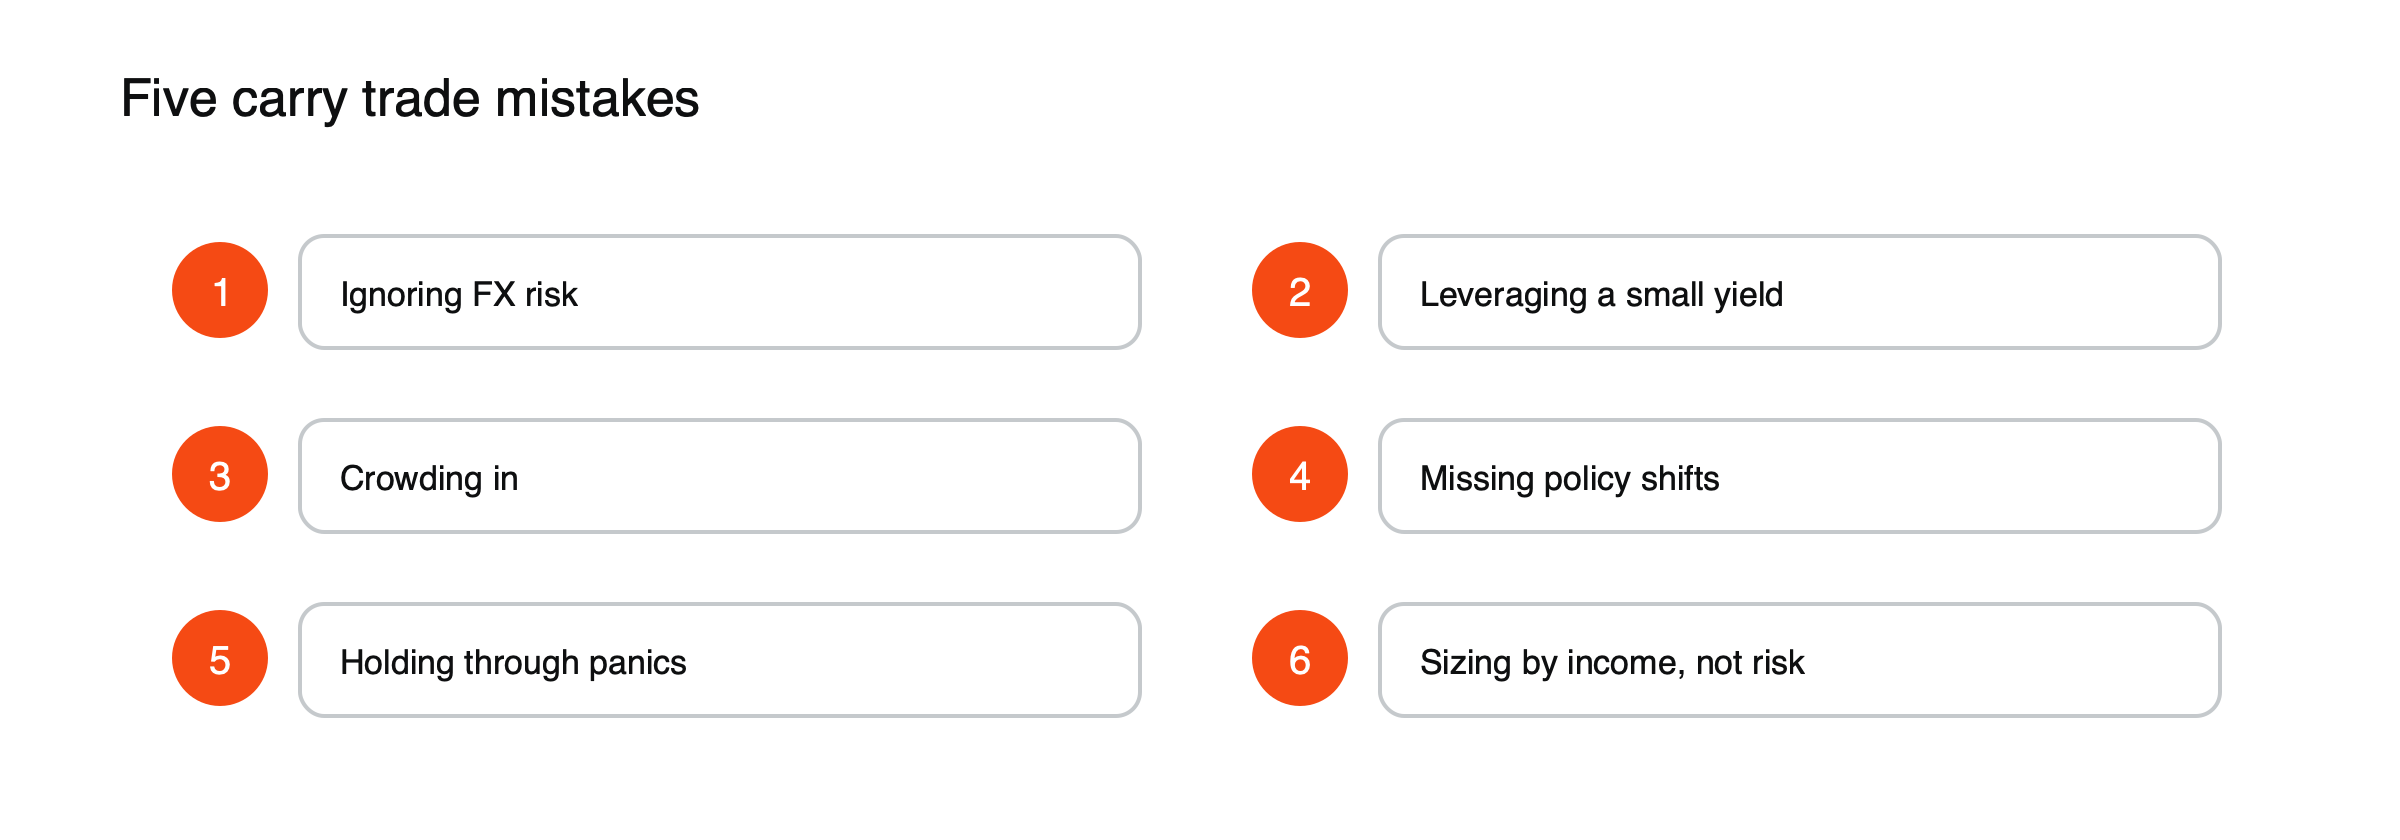
Figure: Five carry trade mistakes.
In every scenario, the income was small compared with the losses, which is the defining feature of carry risk.
Running your own stress test
Before entering a carry trade, write down the position’s annual carry in money, then calculate the loss from moves of 3%, 5%, 8% and 12% against it. Compare each loss with your account size and with the number of months of carry it would erase. If an 8% move, which major pairs have produced in a single week, would cost more than you are willing to lose, the position is too large. Repeat the test whenever the rate gap, volatility or your account size changes.
What 2024 showed
The yen rose about 14% against the dollar between early July and early August 2024 as carry trades unwound after the Bank of Japan’s rate rise and a weak US jobs report. Positions that had earned steady income for months gave it back in days. The episode combined several of the scenarios above at once, a central bank turning, a risk-off week and a crowded exit, which is how real unwinds usually unfold. See what happened in the August 2024 yen carry trade unwind.
Early signs that a scenario is approaching
Each scenario above tends to announce itself. Officials of the funding currency’s central bank start talking about rising inflation or the side effects of low rates. Volatility in the pair begins to rise from very low levels. Stock markets wobble and credit spreads widen. Positioning data show speculators heavily short the funding currency. None of these signals guarantees a reversal, but two or three together suggest that the margin of safety on a carry trade is shrinking. Reducing size at that stage costs a little income; waiting for confirmation can cost months of it.
Protecting a carry position
Traders use several forms of protection. A stop-loss caps the loss in normal conditions, though gaps can carry the price beyond it. A small opposite position in a haven currency, such as a long yen position elsewhere, can offset part of a risk-off loss. Some professionals buy options that gain if the funding currency surges, paying a premium that reduces the carry but limits the worst outcome. Whatever the method, protection costs money in calm markets, and that cost should be counted against the carry before the trade is opened.
The same risks in other pairs
The scenarios apply to any carry trade, not just USD/JPY. AUD/JPY combines a risk-sensitive currency with a funding currency, so its losses in a risk-off week can be even larger. Carry trades in emerging market currencies against the yen or dollar offer higher rate gaps but face sharper falls, wider spreads and the possibility of capital controls. The higher the income, the more severe the stress test usually needs to be. See how emerging market currencies behave when risk appetite falls and what moves currency prices.
Tracking carry separately
In a trading journal, record carry income separately from price gains and losses on each position. Over a year, the comparison shows whether the carry actually paid for the exchange-rate risk taken, or whether most of the result came from price moves that could have happened in any trade. That honest split is the best guide to whether carry trades deserve a place in your approach at all. It also clearly shows which pairs actually earned their keep over time.
This article is educational content and does not constitute financial, investment, legal or tax advice. Digital assets are volatile and you may lose the amount you invest.