
How to Read a Cash Flow Statement
Read cash from operations, investing and financing, compare operating cash flow with net income and calculate free cash flow: a step-by-step guide.
To read a cash flow statement, look at its three sections, cash from operating, investing and financing activities, compare operating cash flow with net income to judge earnings quality, calculate free cash flow, and see how the company used its cash. Unlike the income statement, it shows real money moving in and out.
Before you start
Have the income statement alongside: the cash flow statement usually starts from net income and adjusts it.
Reading it, section by section
Operating activities
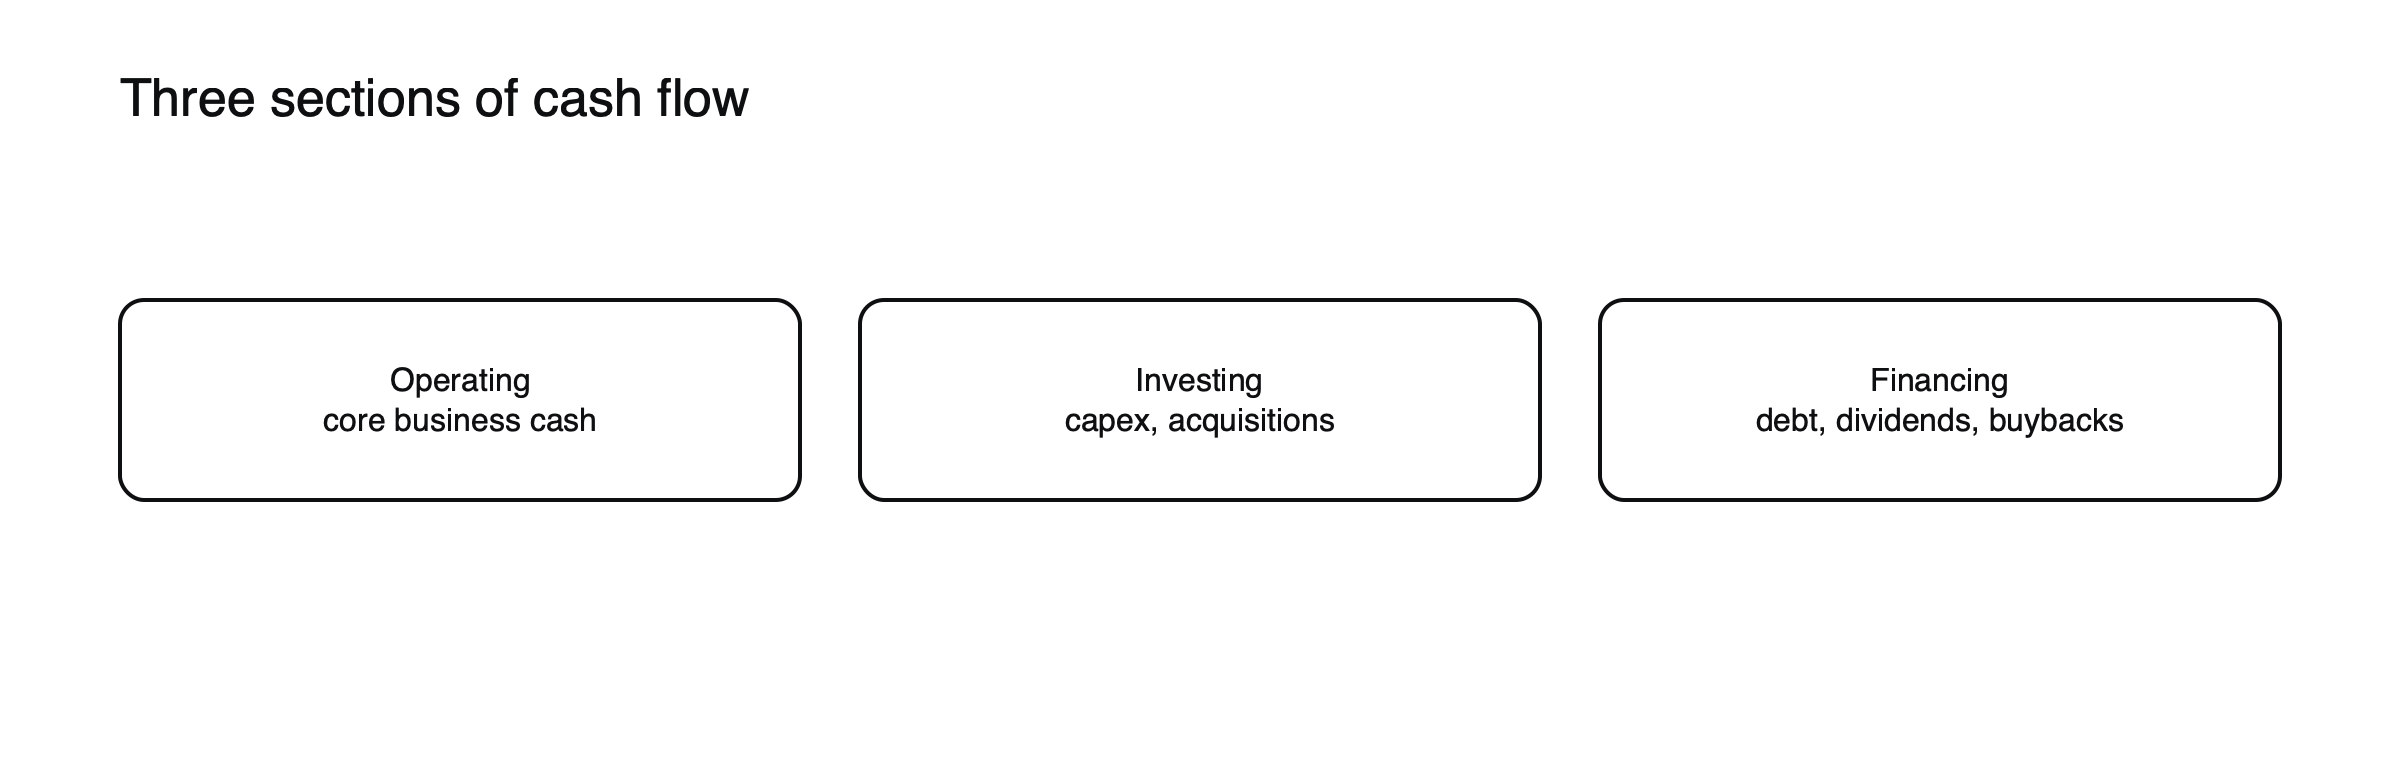
Figure: The three sections of the cash flow statement.
Cash from the core business: net income adjusted for non-cash items such as depreciation and changes in working capital. ExampleCo: $160 million.
Compare with net income
ExampleCo’s operating cash flow of $160 million exceeds net income of $97.5 million, a healthy sign. If net income regularly exceeds operating cash flow, profits may be of lower quality.
Investing activities
Capital expenditures, acquisitions and asset sales. ExampleCo spent $60 million on capital projects.
Free cash flow
Operating cash flow − capex = $100 million. See how to calculate free cash flow.
Financing activities
Borrowing, debt repayment, dividends and buybacks. Shows how cash was returned to shareholders or raised.
ExampleCo’s cash flow statement
| Line | $ million |
|---|---|
| Net income | 97.5 |
| Depreciation and amortization | 50 |
| Other non-cash items and working capital | 12.5 |
| Cash from operating activities | 160 |
| Capital expenditures | (60) |
| Cash from investing activities | (60) |
| Dividends paid ($1.17 × 50 million shares) | (58.5) |
| Share buybacks | (20) |
| Debt repaid | (10) |
| Cash from financing activities | (88.5) |
| Net change in cash | 11.5 |
(Hypothetical company.) Operating cash flow comfortably covers capital spending, and the remaining free cash flow of $100 million covers dividends of $58.5 million, buybacks and some debt repayment, with a little cash left over.
Why profit and cash differ
Depreciation reduces profit but uses no cash, so it is added back. If customers pay more slowly, receivables rise and cash lags profit; if the company pays suppliers more slowly, cash runs ahead. Share-based pay, impairments and gains on asset sales also create differences. Over several years, a healthy company’s operating cash flow usually matches or exceeds its net income. A persistent gap the other way is worth investigating.
Common mistakes
Treating a single year’s negative free cash flow as bad without checking for heavy investment, and ignoring one-off working capital swings. See how to read a balance sheet and what moves stock prices.
Reading the financing section
The financing section shows how a company funds itself and rewards shareholders. Steady dividends and buybacks covered by free cash flow suggest a mature, cash-generative business. Dividends paid with borrowed money, or regular share issues to fund operations, suggest the business is not yet self-funding. ExampleCo’s dividends equal about 59% of its free cash flow, leaving room to maintain them in a weaker year.
Red flags in cash flow
- Operating cash flow consistently below net income.
- Rising receivables or inventory far faster than sales.
- Capital spending persistently below depreciation in a capital-heavy business, which may mean underinvestment.
- Dividends or buybacks funded by new debt.
- Large one-off inflows, such as asset sales, hiding weak operating cash flow.
Cash conversion
Two simple ratios summarize how well profit turns into cash. Operating cash flow divided by net income, 160 ÷ 97.5 ≈ 1.64 for ExampleCo, shows that each dollar of reported profit brought in about $1.64 of operating cash, helped by depreciation. Free cash flow divided by net income, 100 ÷ 97.5 ≈ 1.03, shows that after investment the company still generated slightly more cash than profit. Ratios well below 1 over several years are a reason to look more closely. (Hypothetical figures.)
A growing company, illustrated
Suppose a young company reports operating cash flow of $50 million but spends $120 million on new factories, so free cash flow is −$70 million. It raises $100 million by issuing shares. (Hypothetical figures.) Its cash flow statement shows a business that is not yet self-funding and depends on investors’ willingness to provide capital. That can be perfectly sensible if the factories will earn good returns, but it means the company is exposed if financing markets close.
Seasonal swings
Many businesses build inventory before busy seasons and collect cash afterward, so operating cash flow can swing between quarters. A retailer may show weak cash flow in the months before the holiday season and strong cash flow afterward. Comparing full years, or the same quarter across years, avoids misreading these swings.
Two ways to present operating cash flow
Most companies use the indirect method, starting from net income and adjusting for non-cash items and working capital, as in the table above. A few use the direct method, listing cash received from customers and paid to suppliers and staff. Both reach the same total; the indirect method makes it easier to see why profit and cash differ.
How traders use it
Traders watch cash flow in results releases because a strong profit with weak cash flow can trigger doubts, while cash flow beating expectations can support a share even when earnings disappoint. Free cash flow guidance has become a key number for many companies.
Capital spending against depreciation
Comparing capital expenditure with depreciation shows whether a company is maintaining, growing or running down its asset base. ExampleCo spends $60 million a year against $50 million of depreciation, a little more than needed to replace worn-out equipment, consistent with modest growth. A business spending far below depreciation for years may be boosting short-term cash at the expense of its future; one spending far above it is investing heavily, which should show up in growth later. (Hypothetical figures.)
Where the cash goes over time
Reading several years of cash flow statements together shows a company’s priorities. Some reinvest most of their cash in growth; others pay steady dividends and buy back shares; others use cash mainly to repay debt or make acquisitions. A pattern of large acquisitions followed by write-downs, or of buybacks at high prices followed by share issues at low prices, says something about management’s judgment. The cash flow statement is where those choices are easiest to see.
Cash flow and debt
Lenders look closely at cash flow because it is what repays debt. ExampleCo’s operating cash flow of $160 million covers its $20 million of annual interest eight times over, a comfortable margin. A company whose cash flow barely covers its interest has little room if business weakens. (Hypothetical figures.) Cash-based cover is often a far more reliable test than profit-based measures.
Frequently asked questions
Is negative free cash flow always bad?
No. Fast-growing companies often invest heavily, producing negative free cash flow for years. What matters is whether the investment is likely to pay off and whether the company can fund it.
Why do investors trust cash flow more than earnings?
Because cash is harder to shape with accounting choices than profit. A company can report profits while running short of cash, but it cannot pay dividends or debts without cash.
Company figures in this article are a hypothetical example (“ExampleCo”) for illustration.
This article is educational content and does not constitute financial, investment, legal or tax advice. Digital assets are volatile and you may lose the amount you invest.