
How to Research a Stock Before Trading Its CFD
Check the business, results and guidance, valuation, upcoming events, short interest and liquidity, then size the trade: a stock research checklist for CFDs.
To research a stock before trading its CFD, understand how the company makes money, read its latest results and guidance, compare its valuation with peers, check upcoming earnings and dividends, look at short interest and liquidity, then set size and stops. Research does not guarantee a good trade but avoids surprises.
Before you start
Have the company’s latest annual and quarterly reports and a calendar of upcoming events.
Researching it, step by step
Understand the business
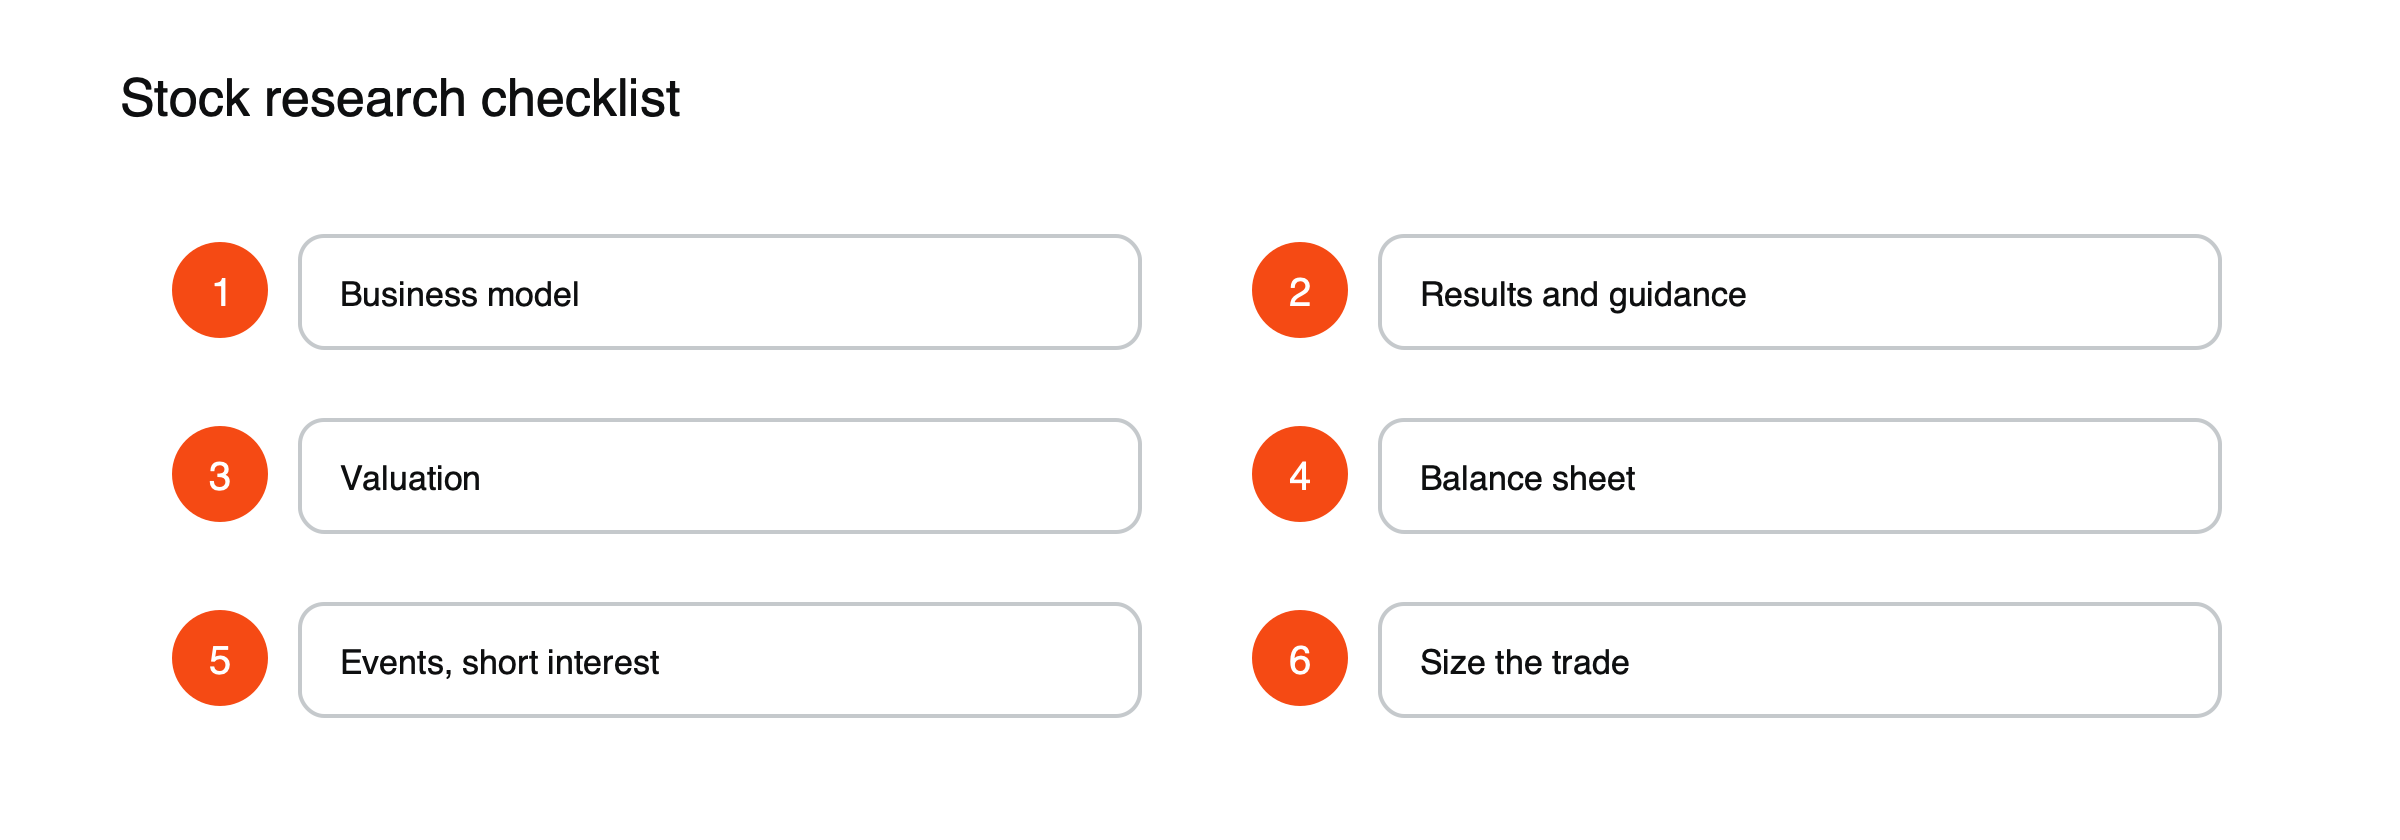
Figure: A research checklist before trading.
What it sells, to whom, and what drives profits. Read the company’s annual report summary.
Read the latest results and guidance
Revenue, margins, cash flow and outlook. See how to read an earnings report.
Check valuation
P/E, EV/EBITDA and free cash flow yield against peers and history. See how to calculate and read a P/E ratio.
Check the balance sheet
Debt, cash and liquidity. See how to read a balance sheet.
Note upcoming events
Earnings dates, ex-dividend dates, product launches and index changes.
Check short interest and liquidity
Heavily shorted or thinly traded stocks can gap. See what short interest is.
Size the trade
Set the stop and size from your risk. See how to calculate your exposure on a stock CFD.
A research note, illustrated
Here is how a one-page note on ExampleCo might look. (Hypothetical company.)
- Business: sells industrial equipment; revenue $1,000 million; customers in manufacturing.
- Latest results: revenue up 11%; operating margin 15%, up from 14%; guidance raised slightly.
- Valuation: P/E 20, EV/EBITDA 11, free cash flow yield about 5%, close to peers.
- Balance sheet: net debt $250 million, about 1.25 times EBITDA; interest cover 7.5 times.
- Events: results in five weeks; ex-dividend date in two weeks.
- Short interest and liquidity: short interest low; spreads tight.
- Beta: about 1.2; cyclical exposure.
- Plan: long on improving margins; stop below recent support; size so that a 10% gap at results costs no more than 1.5% of the account; review after results.
The note takes perhaps an hour to prepare and makes every assumption explicit.
Where to find information
Companies’ investor relations websites carry annual and quarterly reports, results presentations and call recordings. Regulatory filings, such as those on the SEC’s EDGAR system, contain the full financial statements and risk disclosures. Financial websites provide prices, valuation ratios, consensus estimates and short interest. News services and industry publications add context about competitors and the sector.
Questions about the business
- How does the company make money, and from whom?
- What gives it an edge over competitors?
- Is demand for its products growing, stable or shrinking?
- How sensitive are its profits to the economy, interest rates and input costs?
- Who runs it, and how have they allocated capital in the past?
Common mistakes
Trading on a headline without checking the earnings date, and ignoring how the stock behaves with the market. See what moves stock prices.
Adding price context
Fundamental research tells you what a company is worth; the chart tells you how the market currently sees it. Many traders check the recent trend, key support and resistance levels and how the share has reacted to past results before entering. A strong fundamental case in a share that is falling sharply may be worth waiting on until the selling slows.
The risks section
Every research note should list what could go wrong: a weak economy, a competitor’s product, a regulatory decision, a failed product launch, rising debt costs. Writing these down before trading makes it easier to recognize them if they start to happen, rather than explaining them away.
How much time to spend
A full first look at a company can take several hours; updates after each quarterly report take much less. For short-term trades, a shorter checklist focused on events, liquidity and sizing may be enough. The key is to match the depth of research to the size and holding period of the position.
Turning research into a plan
Research becomes useful when it produces a written trade plan: the reason for the trade, the entry level, the stop and its reasoning, the target, the size based on risk and the events that will trigger a review. Without that, research can become a justification for a trade already decided on impulse.
Comparing with peers, illustrated
| ExampleCo | Peer A | Peer B | |
|---|---|---|---|
| Revenue growth | 11% | 6% | 15% |
| Operating margin | 15% | 12% | 18% |
| P/E | 20 | 16 | 28 |
| Net debt/EBITDA | 1.3× | 2.5× | Net cash |
(Hypothetical companies.) ExampleCo sits between its peers on growth, margins and valuation. Peer A is cheaper but slower and more indebted; Peer B is faster growing and stronger financially but much more expensive. A table like this turns vague impressions into specific trade-offs and shows whether a company’s valuation fits its quality.
Management and ownership
It helps to know who runs the company and who owns it. Look at management’s track record on targets and capital allocation, how executives are paid and whether insiders own significant shares. Large insider purchases can signal confidence; heavy insider selling, especially after a big rise, deserves attention. Companies controlled by founders through special share classes may make decisions differently from widely held ones.
Red flags
- Profits rising while operating cash flow falls.
- Frequent changes of auditor or finance chief.
- Large, recurring “one-off” charges.
- Debt rising to fund dividends or buybacks.
- Guidance missed several times in a row.
Researching a short
Research for a short position adds questions: how heavily shorted the share already is, how easy and costly it is to borrow, whether a takeover is plausible and when the next catalysts fall. A sound negative view can still lose money if the trade is crowded or a bid emerges. See short selling myths that mislead new traders.
Keeping notes over time
Saving each research note and updating it after results builds a record of how your view of a company has changed and how accurate it was, which improves the next round of research.
A routine before results
In the week before a company reports, update the research note: check the consensus for revenue, EPS and key metrics, note how the share has moved recently, review what management said last quarter and list the questions that would change your view. Decide in advance whether to hold through the report and at what size. After the report, compare the outcome with the note and adjust it.
Finding ideas with screens
Stock screens filter thousands of companies by measures such as valuation, growth, margins or dividend yield. They are useful for generating ideas, but every screen has blind spots, so each result needs the full research process before any trade. See stock valuation mistakes beginners make.
Matching research to trading style
A day trader in a large, liquid share needs mainly the event calendar, liquidity and the market’s direction; a swing trader holding for weeks adds results, guidance and valuation; a position held for months needs the full picture, including the balance sheet, management and competitors. Deciding in advance which level of research a trade requires prevents both skipping essential checks and drowning in detail. The right depth really depends on how long the position will be held.
Frequently asked questions
Do I need to research every stock I trade?
For any position held more than briefly, at least a basic check of events, liquidity and valuation is worthwhile. Short-term trades still need the event calendar.
How often should research be updated?
At least after each quarterly report, and whenever major news arrives.
This article is educational content and does not constitute financial, investment, legal or tax advice. Digital assets are volatile and you may lose the amount you invest.