
How Index Dividends Are Adjusted on a CFD Position
When index members go ex-dividend, the index drops; cash index CFDs offset it with dividend points × value per point. How it works, with a worked example.
When index members go ex-dividend, their prices drop and the index falls by the equivalent “dividend points.” Cash index CFD providers offset this: adjustment = dividend points × value per point, credited to longs and debited from shorts. Futures-based index CFDs get none, as expected dividends are in the futures price.
How dividend points work
Each member’s dividend, weighted by its share of the index, translates into a number of index points. On busy ex-dividend days, many members’ dividends add up to a noticeable index drop that has nothing to do with market sentiment.
Worked example
- Long cash index CFD, $2 per point
- Ex-dividend points that day: 3.5 (example value)
- Index opens 3.5 points lower from dividends alone
- Adjustment: 3.5 × $2 = +$7 credited; a short would be debited $7
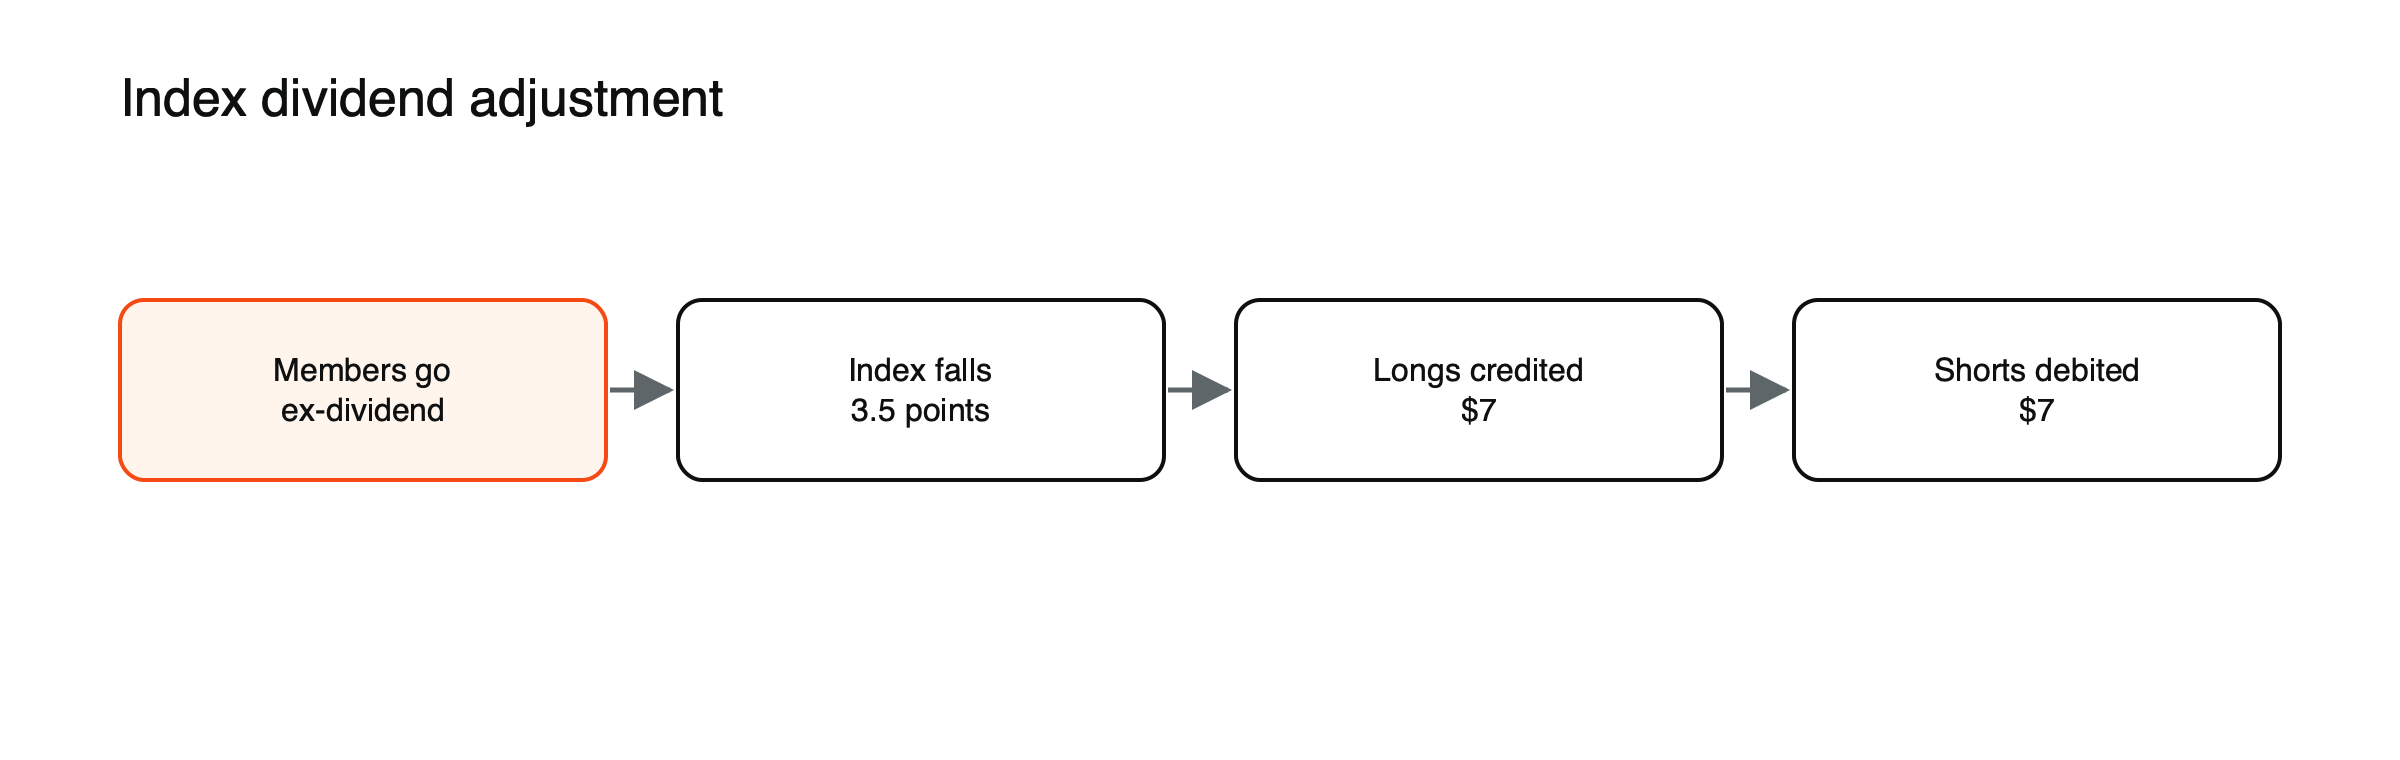
Figure: The dividend adjustment offsets the drop (example values).
Worked example 2: a short in dividend season
A trader is short a European index CFD at €3 per point through a week in which member companies’ ex-dividend dates add up to 25 index points. The index drop from dividends alone shows a gain of about 25 points, €75, but the provider debits about €75 in adjustments, so the short gains nothing from the dividends. If the trader had expected to profit from the dividend season’s drop, the adjustment removes that gain. (Illustrative figures.)
Where the dividend points come from
Each company’s dividend reduces its share price by about the dividend on the ex-date. Its effect on the index depends on its weight: a large company paying a big dividend moves the index more than a small company. Providers estimate the index points from the dividends of all members going ex on each day, and publish or apply those figures to positions held at the previous close.
Why it matters
- Neutral by design: the adjustment offsets the price drop, so long and short positions are not unfairly helped or hurt.
- Stops: the dividend-related drop can still trigger tight stops on longs.
- Seasonality: some indices, such as European ones, have concentrated dividend seasons, producing larger adjustments.
Cash vs futures-based. Futures prices already reflect expected dividends, so futures-based CFDs show no dividend drop and get no adjustment, but their price includes that expectation. See index futures vs index CFDs.
See what happens to a stock CFD on ex-dividend day and how stock index CFDs work.
Dividend seasons
Dividend timing differs between markets. Many European companies pay their main annual dividend in spring, after annual results, so European indices see large dividend drops concentrated in April and May. US companies usually pay quarterly, spreading the effect through the year. UK companies often pay twice a year. Traders holding positions through these periods should expect larger adjustments on certain days.
Price indices and total return indices
Most headline indices, such as the S&P 500 and FTSE 100, are price indices: they fall when members go ex-dividend. Germany’s DAX is a notable exception: it is a total return index, which assumes dividends are reinvested, so it does not drop on ex-dividend dates. CFDs on total return indices therefore usually have no dividend adjustments. Checking which type an index is explains why some CFDs show adjustments and others do not. See what the DAX is.
Withholding and net adjustments
Some providers credit long positions with a net amount after an allowance for withholding tax, while debiting shorts the full gross amount, so the adjustments are not always exactly equal and opposite. The difference is small on most days but can matter in heavy dividend weeks.
A year of adjustments, illustrated
Suppose a US index at 5,000 has a dividend yield of about 1.3%, so its members pay roughly 65 index points of dividends over a year. A long position at $2 per point held all year would receive about $130 in adjustments, spread across many small credits. Over the same year, financing on the $10,000 position at an illustrative 6.8% would cost about $680. The dividends offset part of the financing, but a long cash index CFD still costs money to hold over long periods. (Illustrative figures.)
Dividends and financing together
For a long position, dividend adjustments are income and financing is a cost; for a short, dividends are a cost and financing may be a smaller charge or even a credit. Looking at the two together gives the true cost of carrying an index position, which matters most for positions held for weeks or months. See how CFD overnight financing works.
Ex-dividend days and the open
Because dividends are removed from share prices at the open on ex-dates, an index can open slightly lower on heavy dividend days even if markets are steady. Charts may show this as a small gap. Traders who know the expected dividend points can distinguish this mechanical drop from a genuine move in sentiment.
Special dividends
When a large index member pays a one-off special dividend, the index can drop by more than usual on that day, and the adjustment is correspondingly larger. Providers announce such adjustments in advance, and positions with tight stops may need attention.
How providers calculate the points
For each member going ex-dividend, the provider multiplies the dividend per share by the company’s weight in the index, converting it into index points, then adds up the members going ex that day. Some providers use the index publisher’s official dividend point data; others calculate their own. Small differences between providers’ figures are normal.
Dividends in futures prices
Futures prices already include the dividends expected before expiry, which is why futures-based index CFDs receive no adjustments. A futures-based CFD on an index with large expected dividends trades below the cash index by roughly those dividends, less the interest cost of holding the index. When a big dividend season approaches, that gap widens; as dividends are paid, it narrows. Comparing cash and futures-based CFD prices around dividend seasons shows the effect clearly. See index futures vs index CFDs.
A dividend adjustment checklist
- Is the CFD cash or futures-based?
- Is the underlying a price index or a total return index?
- Which days carry large expected dividend points?
- Are stops placed far enough from the price to survive the dividend drop?
- Does the provider credit longs net of withholding?
Checking these before holding through dividend season avoids misreading mechanical moves as market signals. Most of this information is published by providers in advance of each dividend season.
Frequently asked questions
Do dividend adjustments affect my profit?
They are designed to offset the price drop caused by dividends, so the net effect on equity should be close to zero, apart from any withholding allowance.
Where can I see upcoming dividend adjustments?
Many providers publish expected index dividend points in advance, and some platforms show them in the instrument information.
Leverage, margin and cost figures in this article are example values for illustration. Actual terms depend on the provider, the instrument and the rules in your country.
This article is educational content and does not constitute financial, investment, legal or tax advice. Digital assets are volatile and you may lose the amount you invest.