
Why a Handful of Stocks Can Drive an Entire Index
In cap-weighted indices the largest companies dominate: the S&P 500's top 10 hit a record 40.7% in 2025. Why it happens and what it means for index risk.
A handful of stocks can drive an entire index because most indices weight by market value and the biggest companies have outgrown the rest. The S&P 500’s top 10 reached a record 40.7% of the index at the end of 2025, up from about 18% in 2015, so their earnings and moves largely decide its direction.
How concentration builds
When large companies rise faster than the rest, their weights grow automatically in a cap-weighted index, and index funds buy more of them as money flows in. Information technology’s share of the S&P 500 rose from under 7% in 1990 to close to 40%.
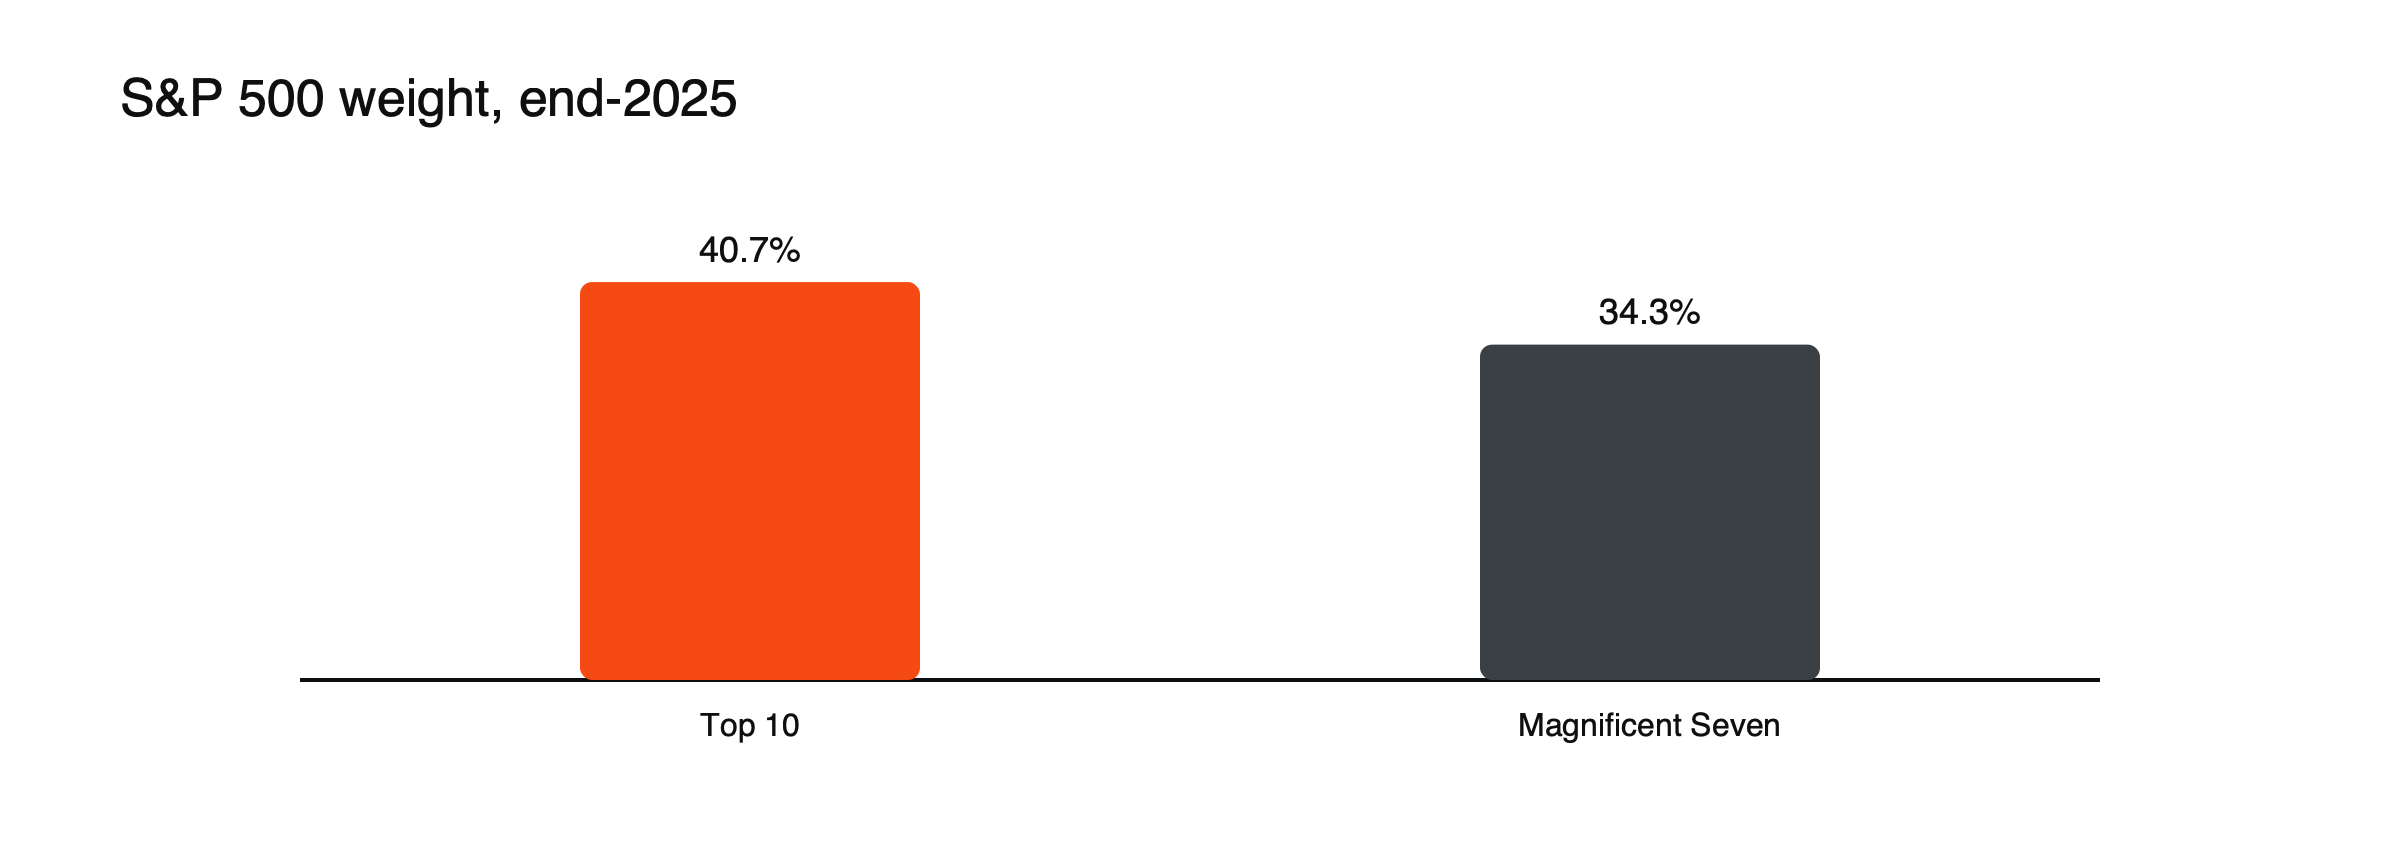
Figure: How much a few stocks weigh. Source: Walnut.
A mega-cap move, illustrated
Suppose the largest company in the S&P 500 carries a weight of about 8% and falls 10% after disappointing results, while every other member is unchanged. (Illustrative figures.) The index falls about 0.8% from that one company. If the three largest members, together weighing around 20%, each fall 5% on the same day, the index drops about 1% even if the other 497 companies are flat. In a concentrated index, the fortunes of a few companies decide most days.
What it means
- Less diversification: an “index” position is largely a bet on a few companies.
- Earnings sensitivity: a single mega-cap report can move the whole index.
- Correlation: the S&P 500 and Nasdaq 100 moved almost in lockstep, with correlation of 0.98 in March 2026.
- Divergence from the typical stock: the S&P 500 has pulled away from its equal-weighted version.
Equal weight versus cap weight, illustrated
Suppose the ten largest members rise 30% in a year while the other 490 rise 5%. (Illustrative figures.) With the top ten at 40% of the index, the cap-weighted index gains about 15%: 40% × 30% plus 60% × 5%. An equal-weighted version, where the top ten are only 2% of the index, gains about 5.5%. The gap between the two is a direct measure of how much the largest companies drove the year. See what market breadth is.
Has it happened before?
Yes, in different forms: technology near the 2000 peak and financials at 20%–22% of the S&P 500 before 2008. Both periods ended badly for the dominant sector. See what caused the dot-com crash.
Concentration in other indices
Concentration is not only an American phenomenon. Japan’s Nikkei 225, which is price-weighted, saw Fast Retailing’s weight reach about 11.4% in early 2025, prompting a cap. The Nasdaq 100 uses modified weighting to limit its largest members, and the DAX caps single companies. The FTSE 100’s largest members, mostly energy, pharmaceutical, mining and consumer companies, also carry large weights, though spread across more sectors than the S&P 500’s technology leaders. See price-weighted vs market-cap-weighted indices.
Why concentration might persist
The largest technology companies earn very high profit margins, generate large amounts of cash and benefit from network effects, scale in data and computing and strong brands. Supporters of the current structure argue that their dominance reflects real economic advantages rather than a bubble, and that their earnings justify their weights.
Why it might reverse
Past periods of extreme concentration have often ended with the leaders falling behind, through competition, regulation, slowing growth or valuations that ran ahead of profits. Rising interest rates have tended to hit the largest growth companies hardest. A rotation toward smaller companies or other sectors can reduce concentration quickly, even without a crash.
What traders can do
Check top weights before treating an index as diversified; watch mega-cap earnings dates; compare with equal-weighted or small-cap indices. See what market breadth is and what moves stock market indices.
Risks for index CFD traders
A long index CFD is now partly a concentrated position in a handful of companies, so their earnings dates, regulatory news and product announcements carry extra risk. Holding long positions in several US indices at once, or adding single-stock CFDs in the same companies, multiplies that exposure. Checking the top weights before trading an index, and treating the largest members’ results as index events, helps keep the risk visible. See how stock index CFDs work.
Measuring concentration
The simplest measure is the combined weight of the top five or ten members. Another is the effective number of stocks, which estimates how many equally weighted companies would produce the same diversification; in a highly concentrated index, it can be far below the actual number of members. Tracking either measure over time shows whether an index is becoming more or less dependent on a few companies.
The index fund feedback loop
As more money flows into funds tracking cap-weighted indices, each new dollar is split according to current weights, so the largest companies receive the most. Rising prices then raise their weights further. Some analysts argue that this feedback loop has contributed to concentration; others note that active investors can still trade against mispricing. Either way, flows into and out of index funds now move the largest companies’ shares in step.
Profits are concentrated too
The largest companies’ share of index earnings has also risen, though usually by less than their share of market value. When market weight grows faster than earnings weight, the market is paying a premium for expected future growth. Comparing the two gives a sense of how much of today’s concentration rests on current profits and how much on expectations.
Concentration and volatility
A concentrated index can be calm when its leaders are stable, but it is vulnerable to sharp moves when news hits them, especially around earnings, regulatory decisions or changes in interest rates that affect growth stocks. Index volatility may understate the risk of a sudden shift in the leaders’ fortunes.
A concentration checklist
- What share of the index do the top five and top ten members represent?
- When do they report results?
- How does the equal-weighted version compare?
- Do you already hold the same companies through other positions?
Common misreadings
- Treating a large number of members as a sign of diversification.
- Assuming concentration must reverse soon.
Past concentrations compared
| Period | Dominant group | What followed |
|---|---|---|
| Around 2000 | Technology and telecom | Dot-com crash; leaders fell sharply |
| Before 2008 | Financials, about 20%–22% of the S&P 500 | Financial crisis; financials collapsed |
| 2025 | Technology, close to 40%; top ten at a record 40.7% | Not yet known |
History does not dictate an outcome, but it shows that periods of extreme concentration have ended badly for the dominant group more than once.
Hedging in a concentrated market
Shorting an index to hedge a portfolio of smaller or more varied shares can leave a mismatch: if the largest companies surge while the rest of the market falls, the hedge loses money at the same time as the portfolio. Choosing a hedge that matches the portfolio, such as an equal-weighted or small-cap index where available, reduces that risk.
Sector concentration
Concentration can also be measured by sector. Information technology’s share of the S&P 500 rose from under 7% in 1990 to close to 40%, and adding communication services companies that are often grouped with technology raises the share further. An index dominated by one sector reacts strongly to that sector’s specific drivers, such as interest rates and technology spending, and less to the rest of the economy. Communication services and consumer companies such as online retailers add further exposure to the same small group of technology-driven businesses, so sector labels can understate how concentrated the index is.
Frequently asked questions
Is high concentration a sign of a bubble?
Not necessarily. It can reflect genuinely dominant businesses. But it increases the risk that problems at a few companies hit the whole index.
How can traders reduce concentration risk?
By comparing cap-weighted with equal-weighted or small-cap indices, limiting combined exposure to the largest companies and watching their earnings dates closely.
This article is educational content and does not constitute financial, investment, legal or tax advice. Digital assets are volatile and you may lose the amount you invest.
Sources
- Stock market concentration statistics (top 10 a record 40.7% at end-2025; Magnificent Seven 34.3%; drove most 2023–2024 returns) — Walnut, 2026
- What past sector concentrations tell us about today’s tech-heavy S&P 500 (IT near 40%; S&P 500 pulling away from its equal-weighted version) — CME Group, 2026
- The evolution of S&P 500 top 10 companies (18%–21% in earlier decades; 38%–39% in 2025–2026) — Landmark Wealth Management, citing JP Morgan
- Nikkei 225 to cap Fast Retailing stock weight (11.4% as of January 31; 10% cap rule from 2022) — Nikkei Asia