
Why It Took the Nikkei 34 Years to Regain Its 1989 Peak
The Nikkei closed at 38,915.87 in December 1989, fell 82% by 2008 and only regained the peak in February 2024. What drove the bubble, slump and recovery.
The Nikkei 225 closed at a record 38,915.87 on December 29, 1989, at the peak of Japan’s asset bubble. After it burst, banks wrote off about ¥100 trillion of bad debts and the index fell 82% by October 2008. It only surpassed the 1989 record on February 22, 2024, 34 years later.
Timeline
- 1980s: the Nikkei rises about sixfold; property and stock prices soar on easy credit.
- December 29, 1989: record close of 38,915.87.
- 1990: the index falls about 39% as interest rates rise.
- 1990s–2000s: banking crisis, deflation and slow growth.
- October 2008: low of about 6,995 during the global financial crisis.
- 2013 onward: policies under Prime Minister Shinzo Abe, including aggressive monetary easing, lift shares.
- February 22, 2024: a new record close.
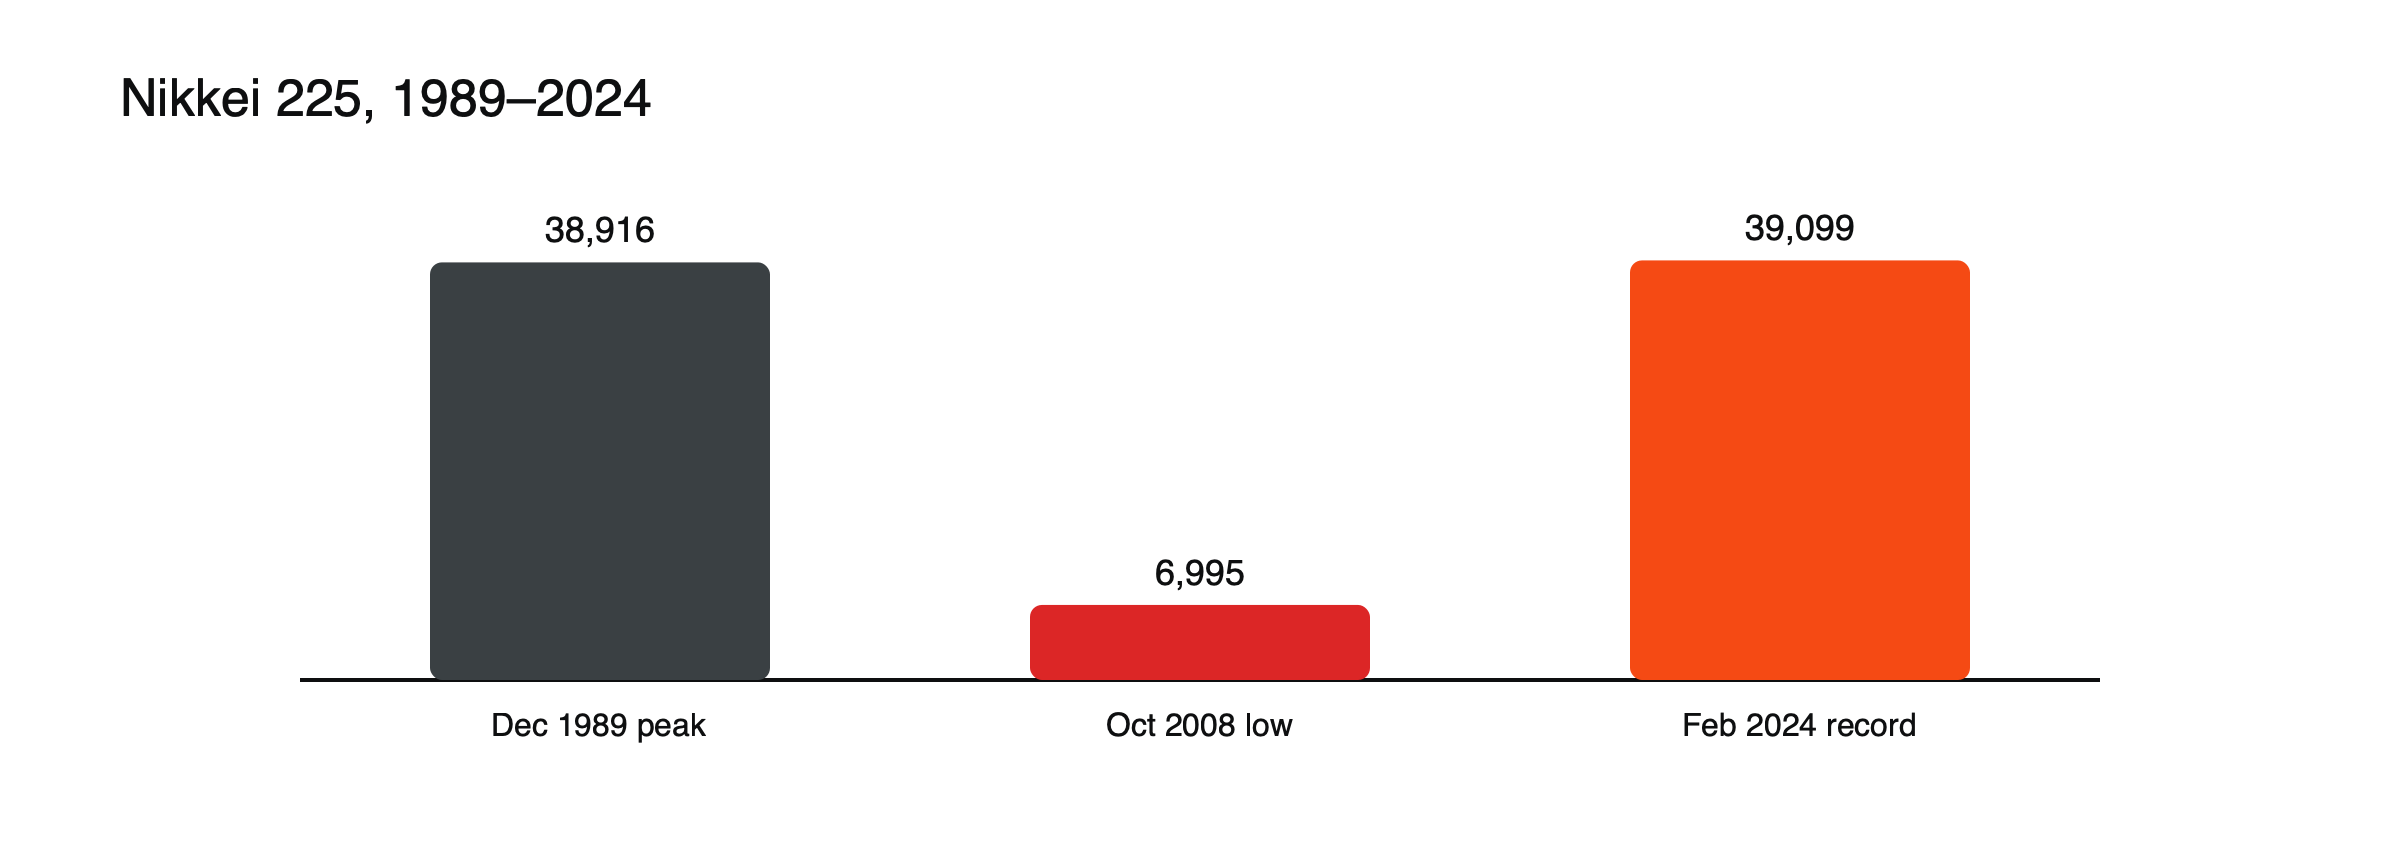
Figure: 34 years from peak to peak. Sources: AP; Wikipedia.
How the bubble formed
In 1985, the Plaza Accord between major economies pushed the dollar down and the yen up. To cushion the effect on exporters, the Bank of Japan cut interest rates, and credit flowed into property and shares. Banks lent heavily against land, whose rising value then supported more borrowing. Prices of land in central Tokyo and shares rose to extraordinary levels, and many believed Japanese assets could only keep rising.
The bubble bursts
From 1989, the Bank of Japan raised interest rates sharply, and the government restricted lending for property. Share prices fell first, about 39% in 1990, then land prices began a long decline. As collateral values collapsed, banks were left with loans that could not be repaid, beginning a banking crisis that lasted more than a decade.
Why recovery took so long
- Bubble valuations: prices far exceeded what earnings could support.
- Bad debts: banks took years to clean up balance sheets, restricting lending.
- Deflation: falling prices and weak growth held back profits.
The lost decades
Through the 1990s and 2000s, Japan suffered slow growth, falling prices and repeated banking problems. Companies focused on paying down debt rather than investing, households saved more and the government ran large deficits to support the economy. Share prices made several rallies but repeatedly fell back, hitting their lowest point in October 2008 during the global financial crisis, about 82% below the 1989 peak.
Abenomics and beyond
From 2013, Prime Minister Shinzo Abe’s policies combined aggressive monetary easing, government spending and structural reforms. The Bank of Japan’s large-scale asset purchases weakened the yen, boosting exporters’ profits, and corporate governance reforms encouraged companies to improve returns to shareholders. These changes laid the groundwork for the rally that eventually took the index past its old record.
What drove the recovery
Record corporate earnings, better corporate governance and shareholder returns, a weak yen helping exporters and strong foreign buying. At the 2024 peak, Tokyo’s P/E was about 16, compared with 23 for the S&P 500.
Lessons
Buying at bubble valuations can take decades to recover in price terms; price indices also understate returns because they exclude dividends. See why it matters whether an index includes dividends, what the Nikkei 225 is and what moves stock market indices.
Price versus total return
The 34 years refer to the Nikkei’s price level. An investor who reinvested dividends would have recovered earlier, because dividends add to returns over such a long period, though the real return over the full span was still very poor. Comparisons between indices over decades should use total return figures where possible.
Comparison with the Nasdaq
The Nasdaq Composite took about 15 years to regain its 2000 peak after the dot-com crash, less than half the time the Nikkei needed. The difference reflects how extreme Japan’s valuations were in 1989, the depth of its banking problems and the long period of deflation that followed.
Lessons for traders
The Nikkei’s history shows that a major index can stay below a peak for decades, that bubbles in property and credit can damage an economy for a generation and that recoveries depend on fundamental changes rather than time alone. For traders, it is a reminder that «buy the dip» works only when the dip is not the start of a long decline.
Timeline at a glance
| Date | Nikkei 225 |
|---|---|
| December 29, 1989 | Record close of 38,915.87 |
| 1990 | Falls about 39% |
| October 2008 | Low near 6,995 |
| February 22, 2024 | New record close above 39,000 |
Land, banks and collateral
During the bubble, Japanese banks lent heavily against property, and rising land prices allowed borrowers to take on more debt. When land prices fell for years after 1990, the collateral behind those loans shrank, and many borrowers could not repay. Banks were reluctant to recognize losses, keeping weak borrowers alive with new loans, which tied up capital and slowed lending to healthy companies. The eventual clean-up, involving bad debts of about ¥100 trillion, took more than a decade.
Cross-shareholdings
Many Japanese companies and banks held large stakes in each other, a practice that protected management from takeovers and outside pressure. When share prices fell, these holdings lost value, weakening balance sheets across the economy. Over time, governance reforms have encouraged companies to sell such holdings, which has improved capital efficiency and returns to outside shareholders.
Deflation
For much of the period after the bubble, prices in Japan fell or barely rose. Deflation discouraged spending, because goods might be cheaper later, and made debts harder to repay in real terms. Company profits and wages stagnated, holding back share prices. Breaking out of deflation became a central aim of Japanese policy.
The 2024 milestone in context
When the Nikkei surpassed its 1989 record in February 2024, Tokyo shares traded at a price-to-earnings ratio of about 16, against about 23 for the S&P 500. In 1989, by contrast, Japanese valuations had been far higher than those of US shares. The new record therefore rested on much stronger earnings rather than on a return to bubble valuations.
Common misreadings
- Assuming major indices always recover within a few years.
- Comparing price levels across decades without considering dividends.
The yen’s role in the recovery
A weak yen was one of the main supports for Japanese shares in the years before the 2024 record. With the Bank of Japan keeping interest rates near zero while other central banks raised them, the yen fell to multi-decade lows against the dollar, lifting the yen value of exporters’ overseas earnings. That support also made the index vulnerable to sudden yen strength, as shown in August 2024. See what the Nikkei 225 is.
The market today
Tokyo’s market has changed significantly since 1989. Companies hold more cash and less debt, pay higher dividends, buy back more shares and face more pressure from shareholders. Foreign investors play a larger role, and the exchange has pushed listed companies to improve capital efficiency. Supporters argue these changes make Japanese shares a fundamentally different investment from the bubble-era market, while skeptics note continuing challenges, such as an aging population and slow domestic growth.
Holding through the decades
An investor who bought at the 1989 peak and held waited more than three decades to see the index price above their entry. Few traders, and certainly few leveraged ones, could have held that long, which is why entry valuations matter so much over long periods.
Frequently asked questions
Did Japanese companies stop growing?
Not entirely. Many continued to earn profits and expand abroad, but their share prices had started from bubble valuations that took decades to justify.
Could another major index suffer the same fate?
Any index bought at extreme valuations can take a long time to recover. The Nikkei is the best-known example among major markets.
This article is educational content and does not constitute financial, investment, legal or tax advice. Digital assets are volatile and you may lose the amount you invest.