
Mistakes Traders Make With Oil CFDs
Six oil CFD mistakes found through a pre-mortem: wrong benchmark, rolls and expiry, event risk, oversizing, curve costs and geopolitical gaps, with warnings.
Common oil CFD mistakes: not knowing which benchmark and contract you trade, ignoring rolls and expiry, holding full size into inventory data and OPEC+ meetings, sizing as if oil were calm, ignoring curve costs and forgetting geopolitical gaps. A pre-mortem, imagining the account has already failed and asking why, shows how they combine.
The pre-mortem method
A pre-mortem reverses the usual review. Instead of asking what went wrong after a loss, you imagine that a plan has already failed and work out the most likely reasons, while there is still time to prevent them. Research on decision-making suggests that imagining a failure as certain helps people spot risks they would otherwise overlook. Applied to oil trading, it turns a list of mistakes into a set of warning signs to watch for from the first trade.
The scenario
It is six months from now. A trader who opened an oil CFD account with $10,000 has lost $6,000, 60% of the account. They traded actively in both WTI and Brent, mostly holding positions for a few days. (Illustrative scenario.) Looking back, what are the most likely causes? Each section below is one plausible answer, with the early warning sign that would have shown it coming and the step that would have prevented it.
Cause 1: the wrong instrument
What happened in the scenario: the trader followed news about Middle East supply and US inventories but traded a WTI CFD tracking a specific futures month. Some moves in the news barely affected their contract; others, such as a build at Cushing, hit it harder than expected.
Early warning sign: confusion about why the CFD moved differently from the headline price.
Prevention: before the first trade, confirm whether the CFD tracks WTI or Brent, a futures month or a cash price, and which news matters most for that benchmark. See WTI vs Brent.
Cause 2: caught by a roll or expiry
What happened in the scenario: a long position was held through a roll in which the next contract traded $1.50 lower. The stop, set $1.00 below the price, triggered on the roll alone, and the trader paid to re-enter.
Early warning sign: not knowing the date of the next roll for an open position.
Prevention: keep a roll calendar, adjust stops before each roll if the provider does not and avoid any product tied to an expiring contract in its final days, the trap that produced negative prices in April 2020. See commodity trading mistakes around contract rolls.
Cause 3: full size into scheduled events
What happened in the scenario: on three Wednesdays, the trader held full-size positions into the weekly inventory report. Twice the first move went against them by more than their stop, and slippage made each loss about half again as large as planned. A full-size position held over an OPEC+ weekend gapped against them on Monday.
Early warning sign: losses clustering on report days and Mondays.
Prevention: mark the weekly inventory report and OPEC+ meetings on the calendar and reduce or close positions beforehand unless trading the event deliberately. See how to read the weekly EIA oil inventory report.
Cause 4: sizing as if oil were calm
What happened in the scenario: the trader habitually held 200 barrels, about $16,000 of exposure at $80, on a $10,000 account. A $3 move, common in volatile weeks, cost $600, 6% of the account, and several such moves in a row did most of the damage.
Early warning sign: single losses regularly exceeding 2% to 3% of the account.
Prevention: size from the stop distance and a fixed risk, for example 1% of the account. With a $1.50 stop and $100 of risk, the position is about 67 barrels, a third of the habitual size. See how to calculate profit and loss on an oil CFD.
Cause 5: the curve worked against the position
What happened in the scenario: during a quiet stretch, the trader held a long position for two months while the market was in contango. The headline price barely changed, but roll costs and financing took about $160 from the account.
Early warning sign: a position going nowhere while slowly losing money.
Prevention: check the shape of the futures curve before any hold longer than a few days, and estimate the cost of holding against the expected gain. See what contango and backwardation are.
Cause 6: a geopolitical gap
What happened in the scenario: the trader was short over a weekend when tensions escalated in a producing region. Oil reopened several dollars higher, and the stop filled far beyond its level. A single weekend accounted for nearly a sixth of the total loss.
Early warning sign: holding positions over weekends while a conflict or sanctions dispute is developing.
Prevention: reduce exposure before weekends during developing situations and accept that stops do not guarantee exit prices in gaps. See how geopolitical events move oil and gold.
How the causes added up
| Cause | Share of the illustrative loss | Main warning sign |
|---|---|---|
| Sizing as if oil were calm | About 40% | Single losses above 2–3% of the account |
| Full size into scheduled events | About 25% | Losses on report days and Mondays |
| Geopolitical gap | About 15% | Weekend positions during conflicts |
| Roll or expiry | About 10% | Unknown roll dates |
| Wrong instrument | About 5% | Moves that don’t match the news |
| Curve costs | About 5% | Flat positions losing money |
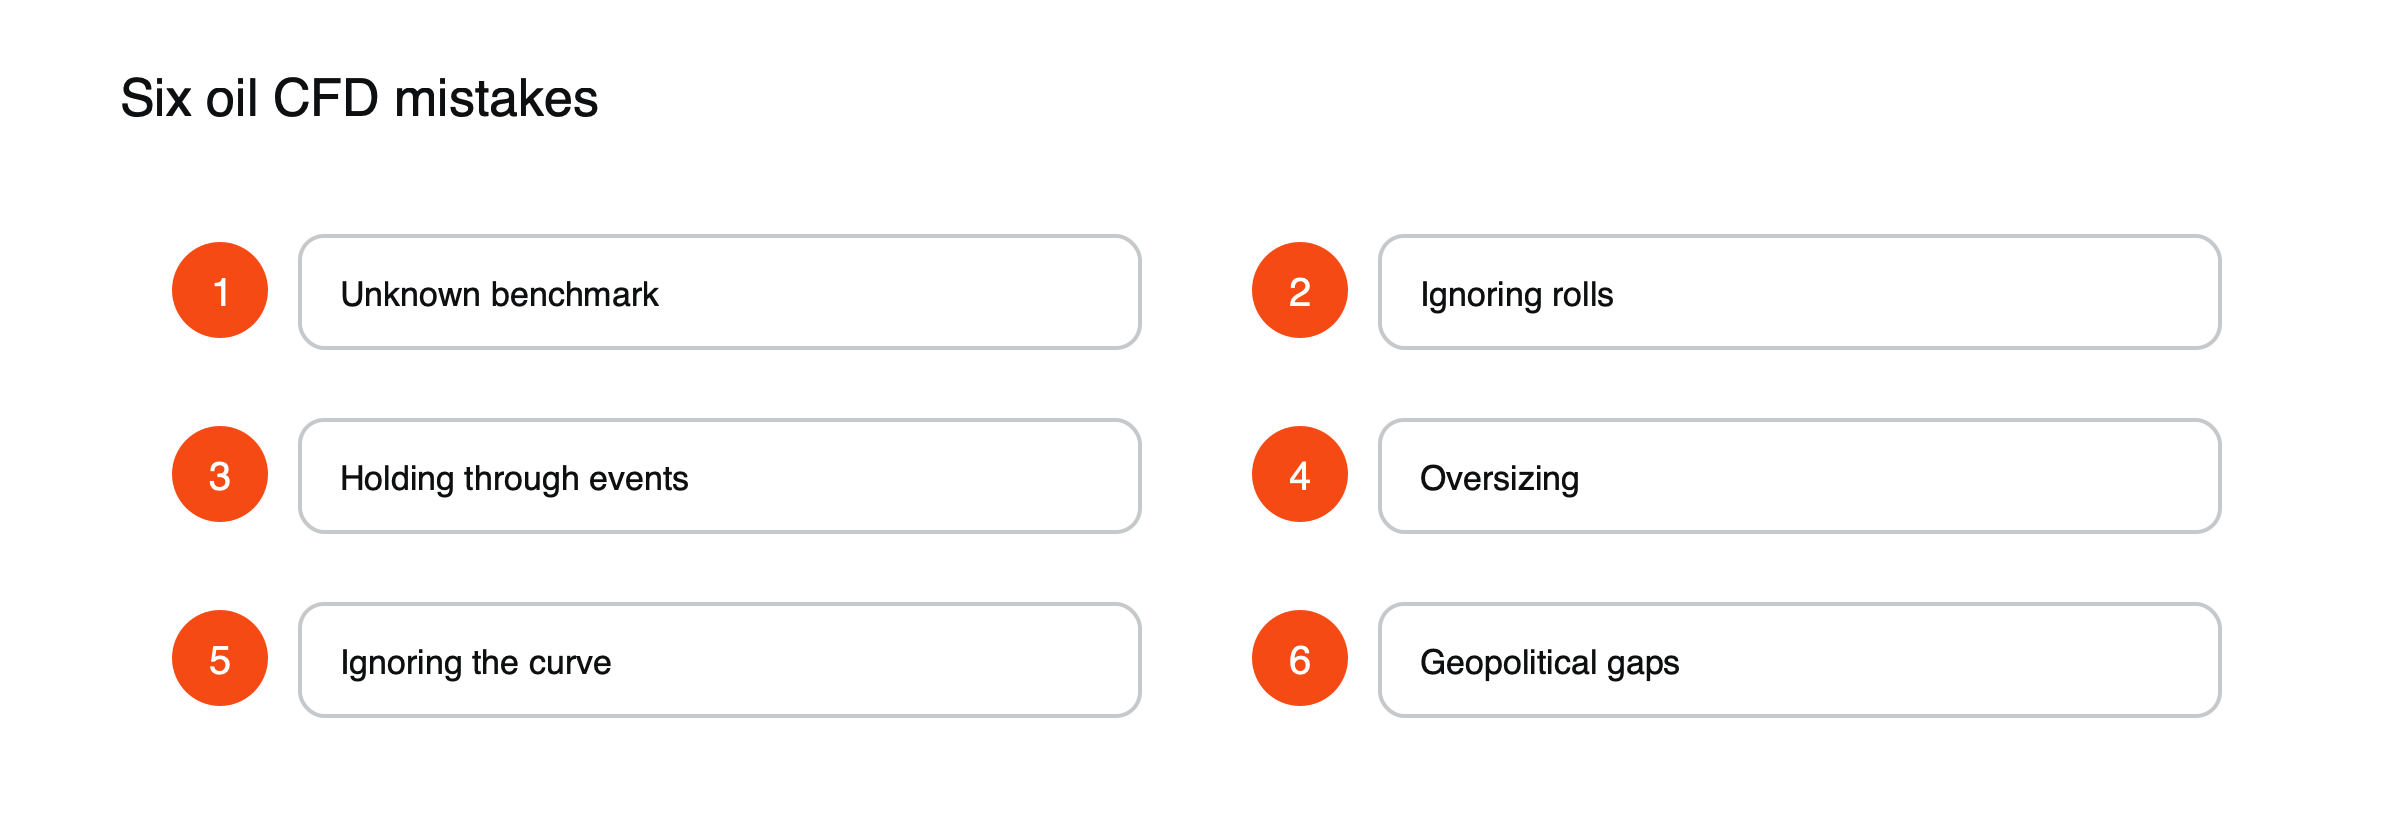
Figure: Six oil CFD mistakes.
The shares are illustrative, but the pattern is common: sizing amplifies every other mistake, which is why it usually accounts for the largest part of the damage.
Running your own pre-mortem
Before your next month of oil trading, write one sentence imagining that the account is down 30%, then list the three most likely reasons based on your own habits. For each, write the warning sign you would see first and the rule that would prevent it. Review the list every week. The exercise takes ten minutes and turns vague caution into specific checks. See what moves crude oil prices and how commodity CFDs work.
Why imagining failure helps
Most traders start a month with resolutions such as “I’ll be more disciplined.” A pre-mortem is more useful because it forces specific answers: which habit is most likely to cause the loss, what it will look like when it starts and what rule will stop it. It also makes it easier to admit risks that feel uncomfortable, such as oversizing after a winning streak, because the failure is imagined rather than real.
Warning signs to check every week
- Did any single loss exceed 2% of the account?
- Were losses concentrated on inventory report days or after weekends?
- Did you hold a position through a roll without checking its date?
- Did a position lose money while the headline price was flat?
- Did any move in your CFD surprise you compared with the news?
A yes to any question points to one of the six causes and to its prevention rule.
Habits that block most causes
Three habits address most of the risks in the scenario: sizing every trade from the stop and a fixed share of the account, reducing positions before scheduled events and weekends during tense periods, and keeping a calendar of roll dates and reports. None depends on predicting where oil will go. They limit how much any single mistake can cost, which is what keeps an account alive long enough for good analysis to pay off.
When the pre-mortem misses something
No list of imagined causes is complete. Markets produce events that few people foresee, such as negative prices in 2020 or the closure of a major shipping route in 2026. The value of a pre-mortem is not that it predicts every risk, but that it builds the habit of asking what could go wrong before it does, and of keeping positions small enough to survive the risks no one listed. If a loss comes from a cause that was not on the list, adding it, together with its warning sign and prevention rule, makes the next pre-mortem better. Over time, the list becomes a personal record of how your oil trading tends to fail and what keeps it safe. Review it after every losing month, not only at the start, so the list keeps pace with how you actually trade oil CFDs.
This article is educational content and does not constitute financial, investment, legal or tax advice. Digital assets are volatile and you may lose the amount you invest.
Sources
- CFTC staff interim report on WTI around April 20, 2020 (fell from $17.73 to settle at −$37.63; first negative price in 37 years; liquidity fell) — CFTC
- Crude oil and petroleum product prices increased sharply in 1Q26 (after military action in the Middle East on February 28 and the de facto closure of the Strait of Hormuz) — US EIA, April 2026