
Why Oil Prices Collapsed Between 2014 and 2016
Brent fell from about $115 in June 2014 to $27 in January 2016 as shale output surged and OPEC chose not to cut in November 2014. What happened and why.
The oil price crash of 2014–2016 took Brent from about $115 a barrel in June 2014 to as low as $27 in January 2016. Booming US shale output created a glut as demand growth slowed, and on November 27, 2014, OPEC chose market share over price by not cutting output, accelerating the fall.
Before the decision
- 2010–2014: US shale output surges; US crude production reaches its highest in decades.
- June 2014: Brent peaks above $115.
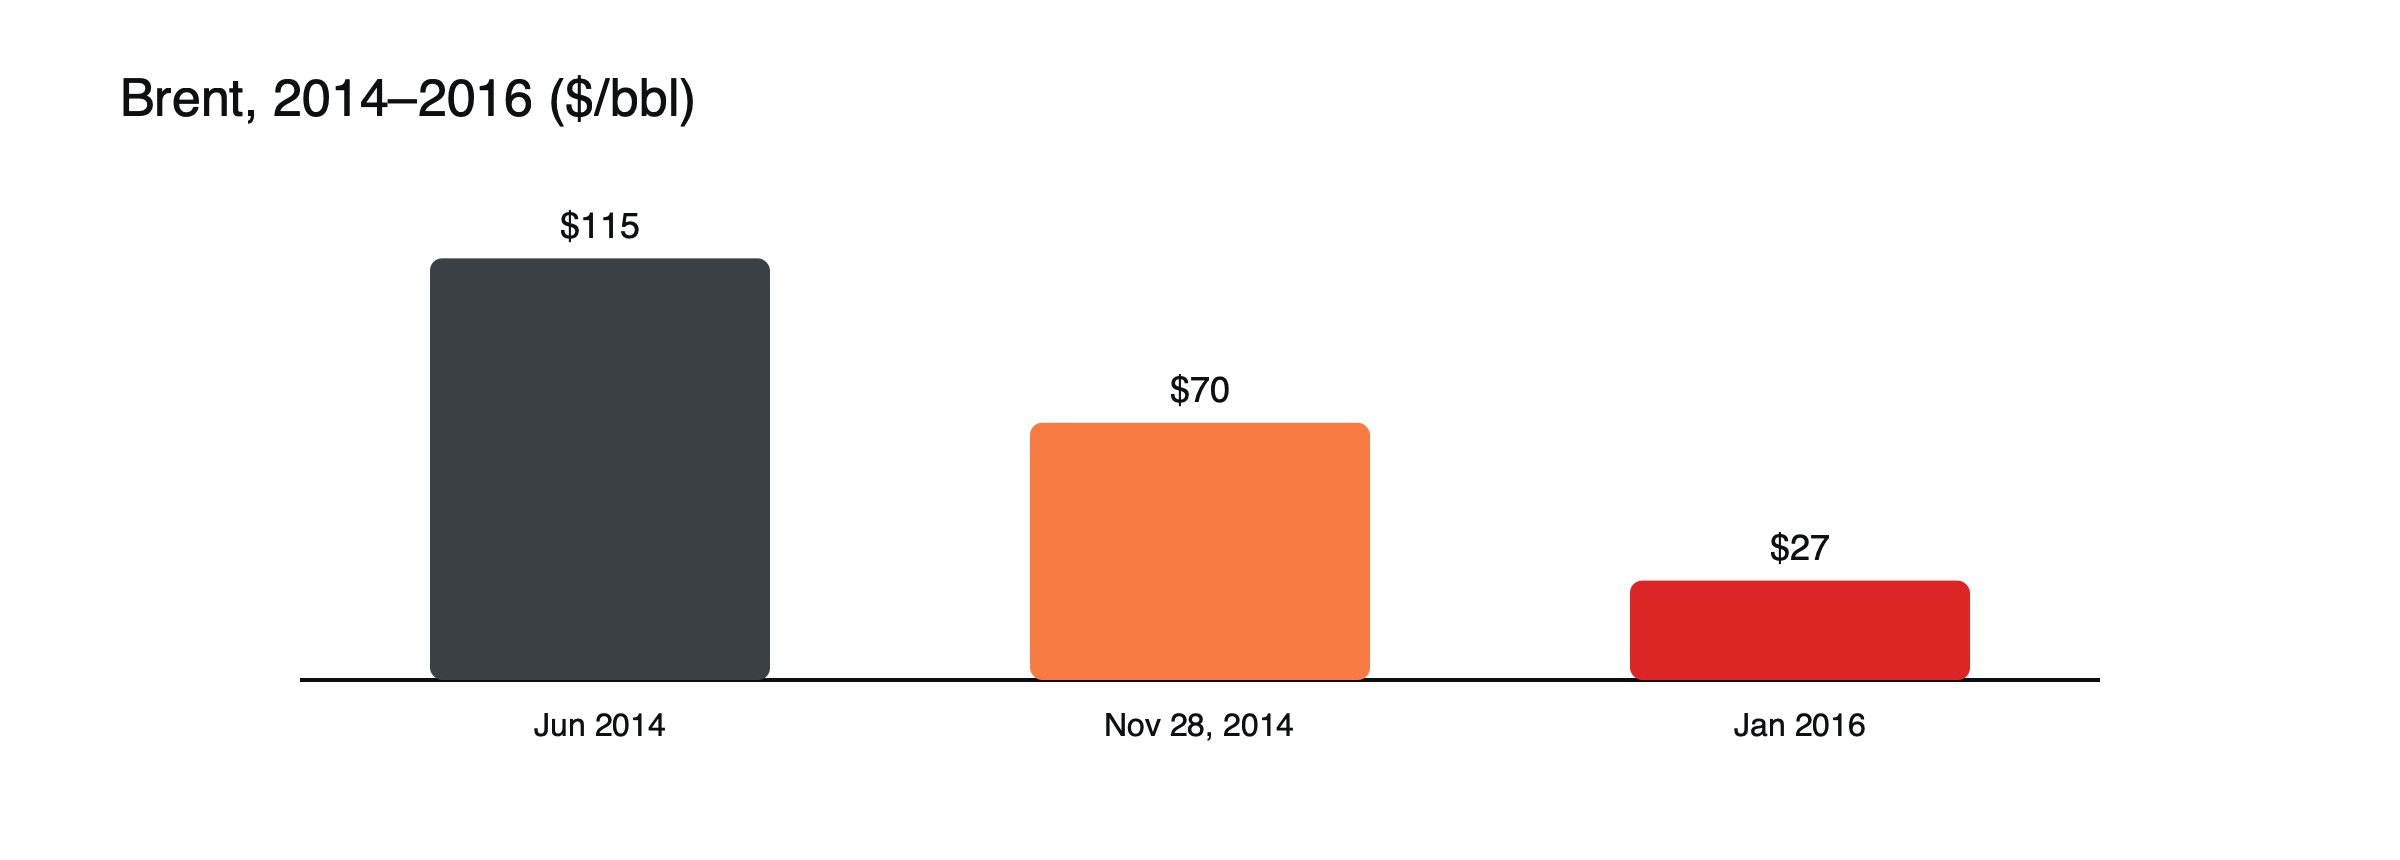
Figure: Brent’s collapse. Sources: ICIS; CNBC.
After the decision
- November 27, 2014: OPEC decides against a cut; Brent falls about $6 a barrel that day.
- January 2015: Brent drops below $50.
- January 2016: Brent touches about $27.
The shale revolution
From around 2010, US producers combined horizontal drilling with hydraulic fracturing to unlock oil trapped in dense rock formations in Texas, North Dakota and elsewhere. Output rose so fast that US crude production reached its highest level in about 30 years by 2014. Shale wells were quick to drill and could be brought into production within months, unlike conventional projects that take years. That speed made shale a new kind of supplier, able to respond to prices far faster than the rest of the industry.
The November 2014 decision
By the autumn of 2014, prices had already fallen from their June peak as supply outpaced demand. Markets expected OPEC, led by Saudi Arabia, to cut production to support prices, as it had in the past. Instead, on November 27, the group kept output unchanged. Saudi officials argued that cutting would simply hand market share to higher-cost producers, including US shale companies, who would fill the gap. Brent fell about $6 a barrel that day, and the decision signaled that the cartel was prepared to let prices fall until high-cost supply was forced out.
The descent
Prices fell in stages rather than in a straight line. Brent dropped below $50 in January 2015, rebounded toward $65 in the spring as investors bet on a quick recovery, then fell again as supply kept rising and inventories swelled. The lifting of sanctions on Iran, agreed in 2015, added the prospect of more supply. By January 2016, Brent touched about $27, roughly a quarter of its 2014 peak. Each rally that failed taught the market that the glut would take longer to clear than hoped.
The OPEC+ response
In late 2016, OPEC and Russia agreed to cut output together, creating OPEC+, which helped prices recover. See what OPEC+ is.
Why it happened
- Shale supply: fast-growing, flexible US production.
- OPEC’s strategy: letting prices fall to pressure higher-cost producers.
- Slower demand in China and Europe.
- A strong dollar, which weighs on dollar-priced commodities.
How shale responded
US producers cut rig counts sharply, laid off workers and slashed spending, and some highly indebted companies went bankrupt. But output fell less than many expected, because companies focused on their best acreage, squeezed costs from service providers and improved drilling techniques. Shale proved more resilient than OPEC had anticipated, which is part of why the group eventually changed course and sought cooperation with Russia.
Who was affected
Oil exporters’ budgets and currencies, energy companies and high-yield bond issuers in the shale sector.
Currencies and economies
Oil exporters’ currencies fell sharply. Russia’s ruble collapsed in December 2014, forcing the central bank to raise interest rates dramatically, and the Canadian dollar and Norwegian krone also weakened. Venezuela, heavily dependent on oil revenue, slid into a deep economic crisis. Oil importers benefited from cheaper fuel, which supported consumers in Europe, Japan and India, though the overall boost to global growth was smaller than many economists expected. See why USD/CAD moves with oil prices.
Energy debt
Many shale producers had borrowed heavily through high-yield bonds while prices were high. As oil fell, those bonds dropped in value and defaults rose, spreading stress into credit markets. The episode showed how a commodity price collapse can turn into a financial problem when an industry is highly leveraged.
A comparison with 1986
The crash echoed an earlier episode. In the mid-1980s, Saudi Arabia, tired of cutting output to support prices while others produced freely, raised production sharply, and oil prices collapsed in 1986. In both cases, the leading producer chose market share over price, and the low prices that followed lasted far longer than many expected.
Lessons
Supply technology can change a market’s structure; cartels may choose market share over price; low prices eventually cut supply, setting up recoveries. See what moves crude oil prices and how commodity CFDs work.
Lessons for traders
The 2014–2016 crash shows that commodity bear markets can last much longer than expected and include powerful but temporary rallies. Positions that bet on a quick recovery in early 2015 suffered when prices fell again. It also shows the value of watching supply indicators, such as rig counts and inventories, and the policy choices of major producers, which can change the direction of a market more than short-term demand data. See what OPEC+ is.
Timeline at a glance
| Date | Event | Brent |
|---|---|---|
| June 2014 | Peak as supply concerns fade | About $115 |
| November 27, 2014 | OPEC keeps output unchanged | Falls about $6 that day |
| January 2015 | Glut deepens; strong dollar | Below $50 |
| Spring 2015 | Short-lived recovery | Toward $65 |
| January 2016 | Low point | About $27 |
| Late 2016 | OPEC and Russia agree joint cuts | Recovery under way |
Storage and the curve
As inventories swelled in 2015, the futures curve moved into steep contango, with later contracts priced well above the front month. Traders with storage bought oil, stored it and sold it forward, filling tanks on land and, at times, tankers at sea. Investors who held oil through futures-based products faced heavy roll costs, so their returns fell even further than the headline price. See what contango and backwardation are.
Why demand disappointed
Demand growth slowed just as supply surged. China’s economy was shifting away from heavy industry and construction, Europe was growing slowly and cars and trucks were becoming more fuel-efficient. Lower prices did eventually lift demand, but much more slowly than supply had grown, so the glut took years to clear.
The dollar’s part
The dollar strengthened sharply from mid-2014 as the US economy recovered and the Federal Reserve prepared to raise interest rates while other central banks eased. A stronger dollar made oil more expensive for buyers using other currencies and added to the downward pressure. See why the US dollar matters for commodity prices.
Lessons for producers
The crash forced the whole industry to rethink. Shale producers learned to cut costs and prioritize their best wells; international oil companies cancelled large, expensive projects; and OPEC learned that it could not drive shale out of business, only slow it. The eventual answer, cooperation with Russia and others in OPEC+, reshaped how supply decisions have been made ever since.
What happened next
The joint cuts agreed at the end of 2016 by OPEC and Russia, combined with recovering demand and falling investment, gradually drew down inventories. By 2018, oil prices had rebounded substantially from their 2016 lows, and US shale output was growing again at lower cost. The new balance did not last: in 2020, the pandemic and a short price war produced an even sharper collapse, including the first negative price for US crude futures. The 2014–2016 episode had shown how quickly supply can overwhelm demand; 2020 showed how quickly demand can vanish. See why oil prices went negative in April 2020. For traders, the sequence is a reminder that oil can swing from glut to shortage and back within a few years, and that positions should be sized for that range of outcomes rather than for the price trend of the moment. In oil, neither glut nor shortage lasts forever.
Frequently asked questions
Why didn’t OPEC cut production in 2014?
Its leading members judged that cutting would mainly help higher-cost producers, such as US shale companies, gain market share, so they let prices fall to test those producers.
Did the crash end the shale industry?
No. Many companies cut back or failed, but the industry adapted, lowered costs and grew again when prices recovered.
This article is educational content and does not constitute financial, investment, legal or tax advice. Digital assets are volatile and you may lose the amount you invest.
Sources
- Oil prices have rebounded since OPEC refused to cut output in 2014 (November 27, 2014 decision; Brent as low as $27.10 in January 2016) — CNBC, May 2018
- Crude extends falls after OPEC decision (Brent high of $115.71 in June 2014; US shale lifted output to the highest in 30 years) — ICIS, December 2014
- Brent dips below $50 (strong dollar; glut; OPEC decision) — Anadolu Agency, January 2015