
How to Calculate and Read a P/E Ratio
P/E = share price ÷ earnings per share. A $150 stock earning $6 a share trades at 25 times earnings. How to calculate trailing and forward P/E and read them.
The P/E ratio compares a share price with earnings per share: P/E = price ÷ EPS. A stock at $150 that earned $6 a share over the past year has a trailing P/E of 25: investors pay $25 per dollar of annual profit. A high P/E usually reflects expected fast growth; a low one, doubts or slower growth.
The formula
P/E = price ÷ EPS
- Trailing P/E uses the last 12 months of reported EPS.
- Forward P/E uses analysts’ estimate for the next 12 months.
Worked example
- Share price: $150
- Trailing EPS: $6 → trailing P/E = 150 ÷ 6 = 25
- Forecast EPS: $7.50 → forward P/E = 150 ÷ 7.50 = 20
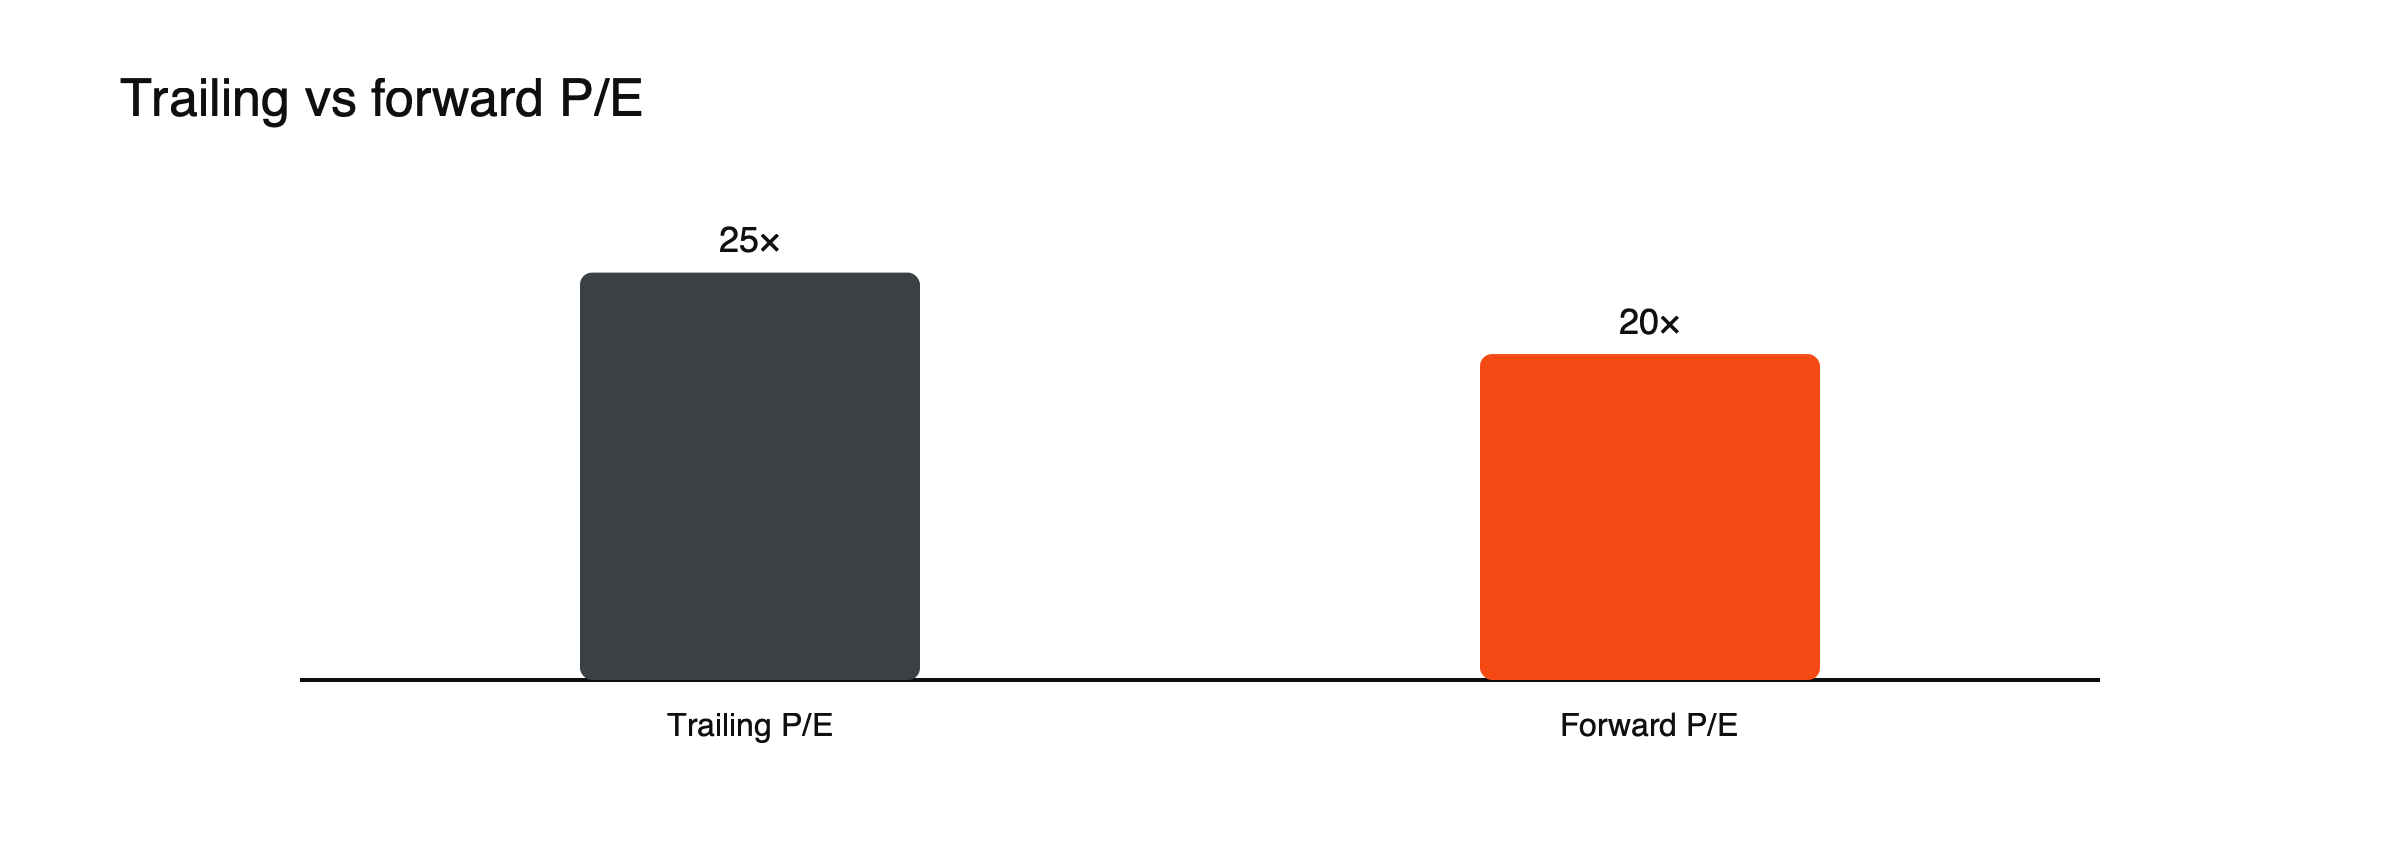
Figure: Trailing vs forward P/E (example values).
The inverse, earnings ÷ price, is the earnings yield: 6 ÷ 150 = 4%, useful for comparing with bond yields.
(Figures above are an example.)
Worked example: ExampleCo
ExampleCo, the hypothetical company used across these guides, earned $1.95 a share last year, and its shares trade at $39, a trailing P/E of 20. If analysts expect earnings to grow 10% to about $2.15, the forward P/E is about 18.2. Its earnings yield is 1.95 ÷ 39 = 5%. (Hypothetical figures.)
P/E and growth: the PEG ratio
A P/E on its own says little about whether a share is expensive, because fast-growing companies justify higher multiples. The PEG ratio divides the P/E by the expected annual earnings growth rate in percent. ExampleCo’s P/E of 20 and 10% expected growth give a PEG of 2.0; a company with a P/E of 30 and 25% growth has a PEG of 1.2, cheaper relative to its growth despite the higher P/E. PEG relies on growth forecasts, which are often wrong, so it is a rough guide rather than a precise measure.
How to read it
- Compare within a sector: software and utilities naturally trade at different P/Es.
- Compare with growth: a high P/E can be reasonable if earnings grow quickly.
- Compare with the company’s own history.
What drives the multiple
Investors pay a higher P/E for companies with faster and more reliable growth, strong competitive positions, high returns on capital and low debt. They pay less for cyclical businesses near peak profits, companies facing disruption or regulation and those with weak balance sheets. Interest rates set the backdrop: when safe bonds yield more, investors demand more earnings per dollar invested, which pushes P/Es down across the market.
Earnings yield versus bond yields
Comparing the earnings yield with government bond yields gives a rough sense of how much extra return shares offer for their extra risk. ExampleCo’s 5% earnings yield against a 10-year bond yielding, say, 4.3% leaves a gap of only 0.7 percentage points; when bond yields were much lower, the same earnings yield looked far more attractive. The comparison is imperfect, because earnings can grow while bond coupons are fixed, but it helps explain why rising yields pressure valuations.
Limits
- No earnings, no P/E: loss-making companies have no meaningful P/E.
- One-off items can distort EPS. See how earnings per share is calculated.
- Debt is ignored: EV/EBITDA accounts for it. See what EV/EBITDA is.
- Rates matter: higher bond yields usually mean lower acceptable P/Es. See how interest rates affect stock prices.
The cyclical trap
For cyclical companies, such as carmakers, miners or chemical producers, a low P/E can be misleading. At the peak of a cycle, earnings are high and the P/E looks cheap, just before profits fall. At the bottom, earnings are depressed and the P/E looks very high, often when the shares are actually cheapest. Analysts sometimes use average earnings over a whole cycle to avoid this trap.
Market-wide P/E
The P/E of a whole index, such as the S&P 500, is watched as a gauge of how expensive the market is relative to its history. A high market P/E does not predict a fall in the short term, but over long periods, starting from high valuations has tended to mean lower future returns. Some analysts prefer a cyclically adjusted P/E that uses ten years of inflation-adjusted earnings to smooth out business cycles.
Using P/E as a trader
Short-term traders rarely buy or sell because of a P/E alone, but changes in the multiple explain many large moves: a share whose earnings beat forecasts can still fall if investors decide to pay a lower multiple for its future. Watching the forward P/E before and after results shows whether a move came from earnings expectations or from the multiple. See what moves stock prices.
Common misreadings
- Calling a stock cheap because its P/E is lower than another company’s in a different sector.
- Ignoring whether earnings are at a cyclical peak.
- Comparing trailing and forward P/Es as if they were the same.
P/E and earnings revisions
Forward P/Es change when prices move and when analysts revise their earnings forecasts. A share whose price is flat while forecasts rise becomes cheaper on a forward basis; one whose price rises while forecasts fall becomes more expensive. Tracking revisions alongside the P/E shows whether a share is getting cheaper because of falling expectations or because of improving earnings.
Very high and negative P/Es
When earnings are close to zero, the P/E becomes very large and unstable: a company earning a few cents a share can show a P/E of several hundred that means little. When earnings are negative, the ratio is not meaningful at all. In these cases, investors look at measures based on sales, cash flow or enterprise value, or at forecast earnings several years ahead.
Different P/Es for different businesses
Fast-growing software and technology companies often trade at P/Es well above the market average, while banks, utilities and energy producers usually trade below it. Those differences reflect growth, risk and how earnings behave through the economic cycle, which is why comparisons are most useful within a sector.
A quick P/E check
- Is the P/E trailing or forward, and are the earnings adjusted?
- How does it compare with sector peers and the company’s own history?
- Are earnings at a cyclical high or low?
- What growth is expected, and how reliable is that forecast?
- What are bond yields doing?
Answering these turns a single number into a useful comparison. Most important, a P/E is a comparison tool rather than a verdict on value. Used that way, it can be very informative and quick.
Frequently asked questions
What is a good P/E ratio?
There is no single good level. It depends on the sector, growth, risk and interest rates. Comparing with peers and the company’s own history is more useful than any fixed number.
Why do some companies have no P/E?
Because they have no earnings, or are losing money, so the ratio is not meaningful. Investors then use other measures, such as price to sales or EV/EBITDA.
Leverage, margin and cost figures in this article are example values for illustration. Actual terms depend on the provider, the instrument and the rules in your country.
This article is educational content and does not constitute financial, investment, legal or tax advice. Digital assets are volatile and you may lose the amount you invest.