
Stocks vs Bonds When Inflation Is Falling
When inflation falls, bonds can hedge stocks again. How the stock-bond relationship depends on inflation, with lessons from 1998 to 2021 and from 2022.
When comparing stocks vs bonds as falling inflation sets in, the main change is that bonds start acting as a hedge again. With inflation low and stable, from 1998 to 2021, stocks and bonds usually moved in opposite directions, so bonds cushioned equity falls. When inflation was high in 2022, they fell together. Falling inflation tends to restore the cushion.
Why inflation decides the relationship
When inflation is the main worry, the same force hurts both: rising inflation pushes interest rates up, which lowers bond prices and also the value investors put on future company profits. When growth is the main worry and inflation is tame, central banks can cut rates in a downturn, so bonds rise while stocks fall.
Side by side
| High or rising inflation | Low or falling inflation | |
|---|---|---|
| Stock-bond correlation | Tends to be positive | Tends to be negative |
| Bonds in a stock sell-off | May fall too | Usually rise |
| Example | 2022: S&P 500 down about 18%, US bonds down about 13% | 2008: Treasuries up about 20% while stocks fell 37% |
A 60/40 portfolio in two regimes, illustrated
Suppose a 60/40 portfolio faces a 20% fall in shares. (Illustrative scenario.) In a low-inflation regime, the central bank cuts rates, bond yields drop 1 point and a bond holding with a duration of about 6 gains roughly 6%. The portfolio loses about 12% from shares and gains about 2.4% from bonds, a net fall of about 9.6%. In a high-inflation regime, yields might rise 1 point instead, cutting bonds about 6% and leaving a net fall of about 14.4%. The same equity shock produces very different outcomes.
What the record shows
From 1998 to 2021, the rolling correlation between US stocks and 10-year Treasuries mostly sat between −0.30 and −0.50. In 2022 it rose to about +0.50, and a 60/40 portfolio lost roughly 17%, its worst year since 1937. From about 1965 to 2000, a period with higher inflation, the correlation was mostly positive.
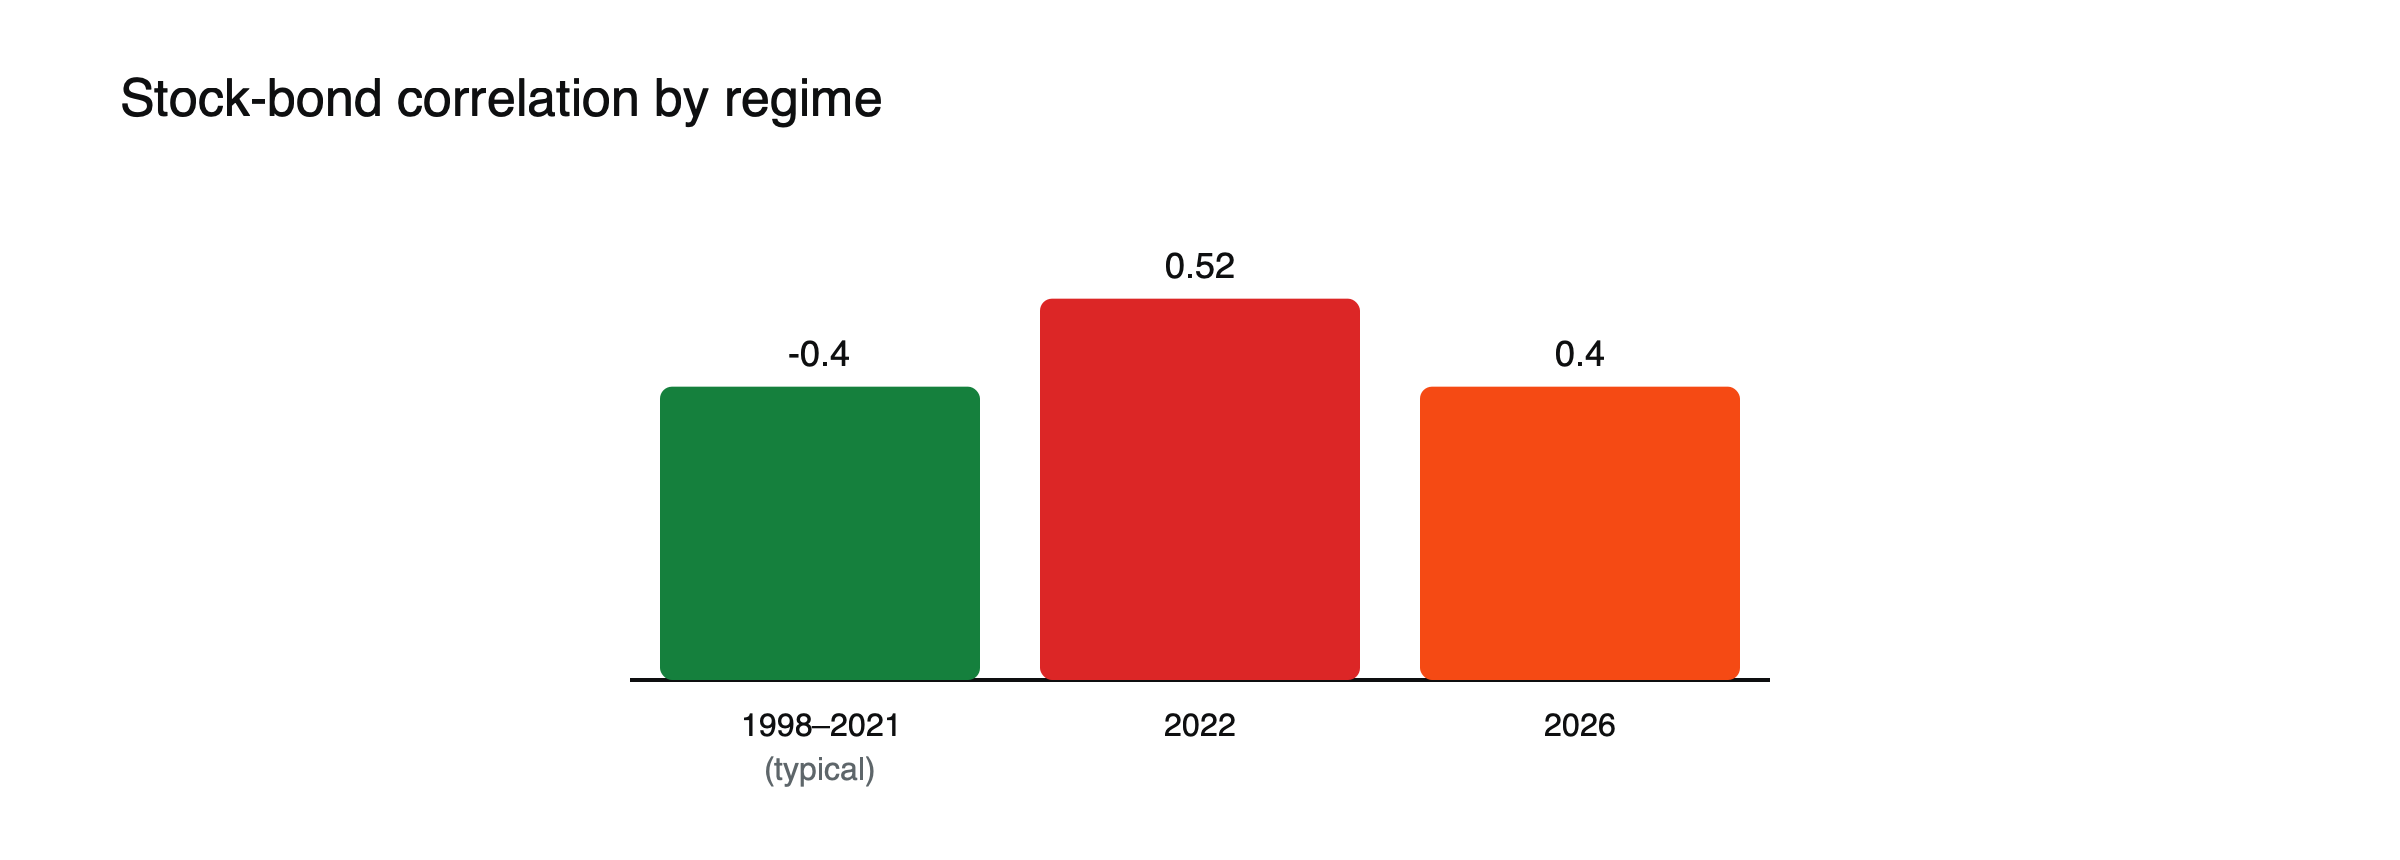
Figure: Rolling stock-bond correlation in different regimes. Source: Voronoi.
The 1965–2000 experience
For much of the period from about 1965 to 2000, when inflation was higher and more volatile, the stock-bond correlation was positive. Bonds often fell when shares fell, especially during the 1970s inflation shocks, and offered less protection than investors came to expect later. The long period of negative correlation that followed coincided with low and stable inflation, which suggests the relationship depends on the inflation regime rather than being a permanent feature of markets. See what the 1970s taught markets about inflation.
Where the usual answer flips
Falling inflation is not always good for stocks. If inflation falls because the economy is weakening sharply, bonds can rally while stocks drop on recession fears. See when bonds rally but stocks don’t.
What it means for portfolios
Bonds hedge best when inflation is under control. If inflation stays volatile, holding other diversifiers, such as cash, gold or commodities, can matter more. See why the stock-bond correlation flipped after 2021 and what happens to stocks in a recession.
Reading the regime
Investors watch inflation trends, central bank credibility and the stock-bond correlation itself to judge which regime they are in. Falling and stable inflation, anchored inflation expectations and a central bank with room to cut point to bonds regaining their hedging role. Volatile inflation and rising expectations point the other way. See how to read breakeven inflation.
What falling inflation does to each asset
Falling inflation lowers bond yields, supporting bond prices, and reduces the rate used to value future profits, supporting shares, especially growth shares. It can also squeeze profit margins if companies lose pricing power. When it comes with steady growth, the combination has historically been favorable for both; when it comes with a slowdown, bonds usually do better.
Other diversifiers
When the stock-bond correlation is positive, investors look elsewhere for diversification: cash and short-term bills, which hold value as rates rise; commodities, which often do well in inflation shocks; gold; and trend-following strategies. Each has its own risks, and none works in every environment. See what 2022 taught investors about diversification.
Higher yields as a cushion
One lasting change after 2022 is that bond yields started from much higher levels. Higher yields mean more income, which cushions bondholders against further rises in yields and gives bonds more room to rally if the central bank cuts. Vanguard noted that in a 2026 rate shock, higher starting income cushioned bond returns far more than in 2022. A bond yielding 4% has much more capacity to offset share losses than one yielding 1%.
Central bank credibility
Bonds hedge shares best when investors trust the central bank to keep inflation under control. Then, in a downturn, they expect rate cuts rather than persistent inflation, and bond yields fall. If credibility weakens, investors may fear that cuts will revive inflation, limiting the bond rally and keeping the correlation positive.
Choosing maturities
Long-dated bonds offer the biggest cushion in a growth scare but the biggest losses in an inflation shock. Short-dated bonds and bills offer less protection in a growth scare but hold up far better when inflation rises. Investors unsure about the regime often split their bond holdings across maturities rather than betting on one outcome. See how bond duration predicts price moves.
Inflation-linked bonds
Inflation-linked bonds can help in regimes where inflation surprises on the upside, because their principal rises with prices, though their prices still fall when real yields rise sharply, as in 2022. See what real yield is.
Common misreadings
- Assuming bonds always hedge shares.
- Writing off bonds as hedges after one bad year.
2022 as a turning point
In 2022, US shares fell about 18% and US bonds about 13%, and the stock-bond correlation rose to about +0.5. A typical 60/40 portfolio lost roughly 17%, its worst year since 1937. The year forced many investors to reconsider the assumption, built over two decades, that bonds would always cushion share losses. As inflation fell afterward, the question became whether the old relationship would return, and how quickly.
Portfolio choices, illustrated
An investor worried about both regimes might hold 55% shares, 30% bonds split between short and long maturities, 10% inflation-linked bonds and 5% cash. (Illustrative mix, not a recommendation.) In a growth scare, the long bonds cushion share losses; in an inflation shock, the short bonds, inflation-linked bonds and cash hold up better. The mix gives up some return in either extreme in exchange for resilience across both.
Share valuations and falling inflation
Falling inflation lets central banks cut rates and lowers the yields used to value companies, which can lift share valuations even if profits are unchanged. Growth shares, whose value lies far in the future, often benefit most. But if inflation falls because demand is collapsing, lower profits can outweigh higher valuations, and shares can fall even as bonds rally. Whether falling inflation is good for shares depends on why it is falling.
Differences between countries
The stock-bond relationship varies across countries depending on their inflation history and central bank credibility. In economies with a long record of stable inflation, bonds have more often hedged shares; in those with volatile inflation, the relationship has been less reliable. International investors therefore cannot assume that government bonds play the same role everywhere, and may diversify across several bond markets.
How to track the regime
A simple approach is to follow the rolling one-year correlation between share and bond returns, alongside core inflation and long-term breakeven inflation. A correlation that turns negative while inflation falls toward target suggests bonds are regaining their hedging role; a positive correlation with sticky inflation suggests caution about relying on bonds. Many data providers publish these figures, and checking them every month or quarter is enough for most investors to adjust their mix gradually rather than reacting to every headline. In practice, a gradual shift of a few percentage points a year between bonds and other diversifiers is usually enough.
Frequently asked questions
Is the 60/40 portfolio dead?
Not necessarily. It suffered badly in 2022, but with inflation falling and bond yields higher, bonds can again cushion shares, though less reliably than before 2021.
What sets the correlation?
Mainly whether growth or inflation is the bigger risk for markets.
This article is educational content and does not constitute financial, investment, legal or tax advice. Digital assets are volatile and you may lose the amount you invest.
Sources
- Stock-Bond Return Correlation Flips Positive (−0.30 to −0.50 in 1998–2021; +0.52 in 2022; 2008 bonds +20.1%, stocks −37.0%) — Voronoi
- The 60/40 Portfolio (positive correlation from about 1965 to 2000; inflation flips correlation) — BIT Knowledge Hub
- The death of the 60/40 (about 17.5% loss in 2022, worst since 1937) — Masterworks Research, June 2026
- How 2026 may set the table for stronger bond returns (2026 rate shock cushioned by higher income than in 2022) — Vanguard, September 2026