
How Recession Signals Have Performed Historically
The yield curve, the Sahm rule and credit spreads had strong records, but the 2022–2024 cycle produced false alarms. How each signal has done and its limits.
Recession signals such as the yield curve, the Sahm rule and credit spreads all built strong track records, then stumbled in the 2022–2024 cycle. The 2-year/10-year curve inverted for a record 26 months without a recession following, and the Sahm rule triggered in July 2024 for the first time since 1970 with no recession behind it.
Timeline of the signals
- Since 1976: five yield curve inversions were followed by recessions.
- July 2022: the 2s10s curve inverts as the Fed hikes rapidly.
- July 2023: the inversion reaches its deepest, about −1.08 percentage points.
- July 2024: the Sahm rule, based on a rise in the unemployment rate, triggers at 0.50.
- August–September 2024: the curve un-inverts after 26 months.
- 2026: no recession has followed either signal.
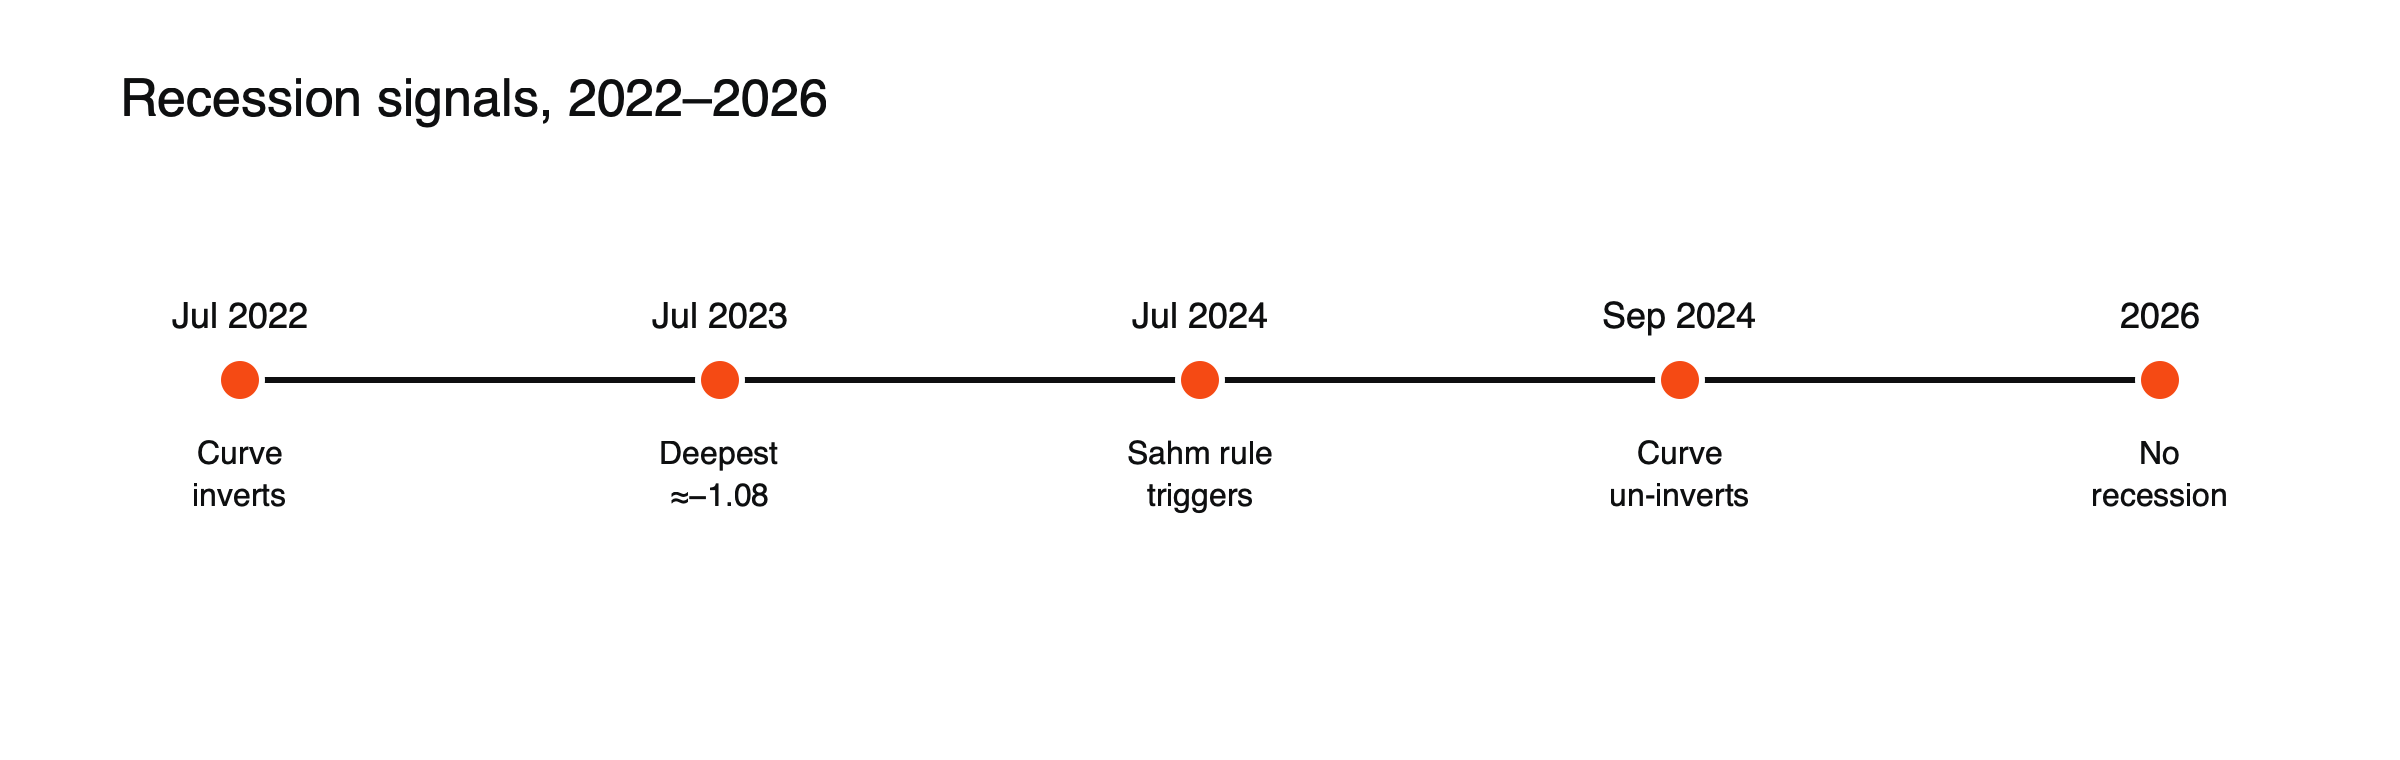
Figure: Two classic signals, no recession so far.
At a glance
| Signal | What it measures | Typical lead | 2022–2026 record |
|---|---|---|---|
| Yield curve (2s10s) | Market expectations for rates and growth | Many months to over a year | Inverted 26 months; no recession by 2026 |
| Sahm rule | Rise in the unemployment rate | Confirms soon after a recession begins | Triggered July 2024; no recession |
| Credit spreads | Default risk priced by bond markets | Three to nine months | Stayed tight |
| Leading indicator indices | Combination of economic and market data | Several months | Fell for long stretches without recession |
The yield curve
A forward-looking market signal that has typically led recessions by many months. One analysis put its success rate at about 71% since 1980.
Why the curve has worked
The curve inverts when markets expect the central bank to cut rates in the future, usually because they expect growth to weaken. Inversions also squeeze bank lending margins and signal tight financial conditions, which can themselves slow the economy. That combination of forecasting and causing explains much of its record. See what an inverted yield curve means.
The Sahm rule
A real-time labor market detector that confirms recessions soon after they begin; its creator calls it an indicator, not a forecast.
How the Sahm rule works, illustrated
The Sahm rule compares the three-month average of the unemployment rate with its lowest three-month average over the previous year. If the difference reaches 0.5 percentage points, the rule signals a recession. Suppose unemployment averaged 3.6% at its low and the latest three-month average is 4.1%: the difference is 0.5 and the rule triggers. (Illustrative figures.) In July 2024, it triggered at 0.50 and peaked at 0.57 in August, the first false signal since 1970, as rising unemployment partly reflected more people joining the labor force rather than layoffs.
Credit spreads
Credit spreads widened before every US recession since 1996 in one dataset, with shorter lead times. See what credit spreads tell equity traders.
Spreads stayed relatively tight through 2022 to 2024, which in hindsight was a better guide to the absence of recession than the yield curve or the Sahm rule. Their peaks, about 21.8% in December 2008 and about 11% in March 2020, came during recessions rather than long before them.
Why they missed
Rate hikes driven by inflation rather than weakening demand, an unusual post-pandemic labor market and years of central bank bond buying may all have distorted the signals.
Lessons
No single indicator is reliable on its own. Combining several, and watching whether they confirm each other, works better. See what happens to markets when the yield curve un-inverts and which cross-asset signals tend to lead stocks.
Other indicators
Many other signals are watched: purchasing managers’ surveys, weekly jobless claims, building permits, consumer confidence and corporate earnings revisions. Each has strengths and blind spots. Manufacturing surveys, for example, spent long periods signaling contraction from 2022 to 2024 while services kept the economy growing, a reminder that the economy has shifted toward services that older indicators capture less well.
Combining signals, illustrated
Suppose an investor tracks five signals and counts how many are flashing warning: an inverted or rapidly re-steepening curve, a triggered Sahm rule, widening credit spreads, falling earnings forecasts and rising jobless claims. (Illustrative method.) One or two warnings are common and often harmless; four or five together have historically been far more reliable. In 2022 to 2024, the curve and Sahm rule flashed, but spreads, earnings and claims did not, which in hindsight correctly suggested caution rather than alarm. See which cross-asset signals tend to lead stocks.
What it means for markets
Markets often fall before recessions are officially recognized, and recover before they end. Waiting for confirmation from lagging data usually means acting too late, while acting on a single early signal can mean selling too soon. Watching a group of signals and adjusting risk gradually is a more balanced approach. See how recessions have affected stock markets.
How markets price recession risk
Markets price recession risk continuously through several channels: rate futures show expected cuts, credit spreads show default fears, defensive sectors outperform cyclical ones and commodity prices weaken. When these market signals move together, they often lead official data. Prediction markets and economist surveys add another view, though they too have missed turns.
Indicators in other countries
Yield curves, unemployment rules and business surveys are used worldwide, but their records vary. Economies with different structures, such as those dominated by exports or by banks, respond differently to tight policy. German manufacturing surveys, for example, have long been watched as an early indicator for Europe, while Chinese credit growth signals shifts in Asian demand.
The cost of false alarms
False signals are costly. Investors who sold shares when the curve inverted in July 2022 missed strong gains in 2023 and 2024. Those who ignored all warnings in 2007 suffered heavy losses in 2008. The difficulty of balancing these errors is why many investors adjust risk gradually rather than reacting fully to any one signal.
Common misreadings
- Treating one indicator as a recession forecast.
- Assuming a signal is broken after one miss.
A recession dashboard
- 2s10s and 3-month/10-year yield curves
- Sahm rule reading
- High-yield credit spreads
- Weekly jobless claims
- Earnings forecast revisions
The 2001 and 2007 signals
Before the 2001 and 2008 recessions, the yield curve inverted, credit spreads widened and unemployment began rising, giving investors several confirming signals. In both cases, the curve then re-steepened as the Fed cut rates, shortly before or as the recessions began. Those episodes built the reputation of the signals and made the misses after 2022 all the more striking.
Leading indicator indices
Some organizations combine several economic and financial series, such as new orders, building permits, jobless claims and the yield curve, into a single leading index. These indices fell for long periods from 2022 to 2024 without a recession following, partly because they gave heavy weight to manufacturing and the yield curve. Their record shows the risk of relying on indicators built for an earlier economy.
Timing, illustrated
Suppose a recession begins in month 12 and ends in month 24. (Illustrative timeline.) Share markets might peak around month 6, as investors anticipate weaker earnings, and bottom around month 18, well before the recession ends, as investors anticipate recovery. Official confirmation of the recession might come only around month 18 as well. An investor waiting for official confirmation would sell near the bottom, which is why markets and official data often seem out of step.
The labor market in 2024
In 2024, unemployment rose partly because more people entered the labor force, including immigrants, rather than because of widespread layoffs. That pushed the Sahm rule over its threshold without the job losses that usually accompany recessions.
The role of fiscal support
Large government deficits after the pandemic supported spending and jobs, helping the economy avoid the recession that many indicators predicted.
How professional forecasters did
Many economists forecast a US recession for 2023, citing the inverted yield curve, falling leading indicators and rapid rate hikes. Instead, growth continued. The experience made forecasters more cautious about relying on traditional signals and more attentive to the unusual features of the post-pandemic economy, such as strong household savings and labor shortages.
Lessons for traders
Recession signals are best used to adjust risk rather than to make all-or-nothing calls. Reducing leverage when several indicators warn together, and adding back exposure as they improve, helps traders avoid both the cost of false alarms and the damage of real downturns. No single reading should decide a trading position alone.
Frequently asked questions
Which recession indicator is most reliable?
None alone. Credit spreads, the yield curve and labor market data each have strong records but also notable misses.
Why did so many signals fail after 2022?
The cycle was unusual: inflation-driven rate hikes, a strong labor market after the pandemic and large fiscal support all distorted traditional signals.
This article is educational content and does not constitute financial, investment, legal or tax advice. Digital assets are volatile and you may lose the amount you invest.
Sources
- Sahm Rule History (first false signal since 1970: triggered July 2024, peaked at 0.57 in August; “an indicator, not a forecast”) — Eco3min
- 2s10s Yield Curve Inversion History (five inversions since 1976 followed by recession; 26-month 2022–2024 inversion with none) — Eco3min
- The Yield Curve Manual (deepest −1.08 points in July 2023) — TheTrading.Tools
- The Yield Curve… Again (71% success rate since 1980) — BMO Economics, September 2024
- Why do credit spreads widen in recessions? (HY spread peaks of 21.82% in December 2008 and about 11% in March 2020) — Eco3min