
How Stock Markets Have Behaved in US Election Years
How the S&P 500 has performed in US presidential election years since 1928, when volatility tends to rise around the vote and why the pattern is a weak guide.
Election year stock market history is less dramatic than headlines suggest. Since 1928, the S&P 500 has usually risen in US presidential election years, though average returns were modestly lower than in other years. Volatility tended to rise in the months before the vote, then fade. The winning party said little about returns.
What the record shows
Returns. T. Rowe Price found average and median S&P 500 returns were modestly lower in presidential election years than in other years over 96 years of data. Parametric found price returns and volatility strikingly similar between election and non-election years.
Mostly positive. A Morgan Stanley analysis found the S&P 500 rose in about 83% of the 23 election years from 1928 to 2016. The four down years were 1932, 1940, 2000 and 2008, each tied to a broader crisis or bust.
Volatility. In election years, average volatility was highest in the one and three months before voting day.
Timeline of a typical cycle
- Year 1 (after the election): markets often adjust as new policies emerge.
- Year 2 (midterms): historically the weakest and most volatile year of the four.
- Year 3 (pre-election): historically the strongest.
- Year 4 (election year): mixed, with uncertainty peaking before the vote.
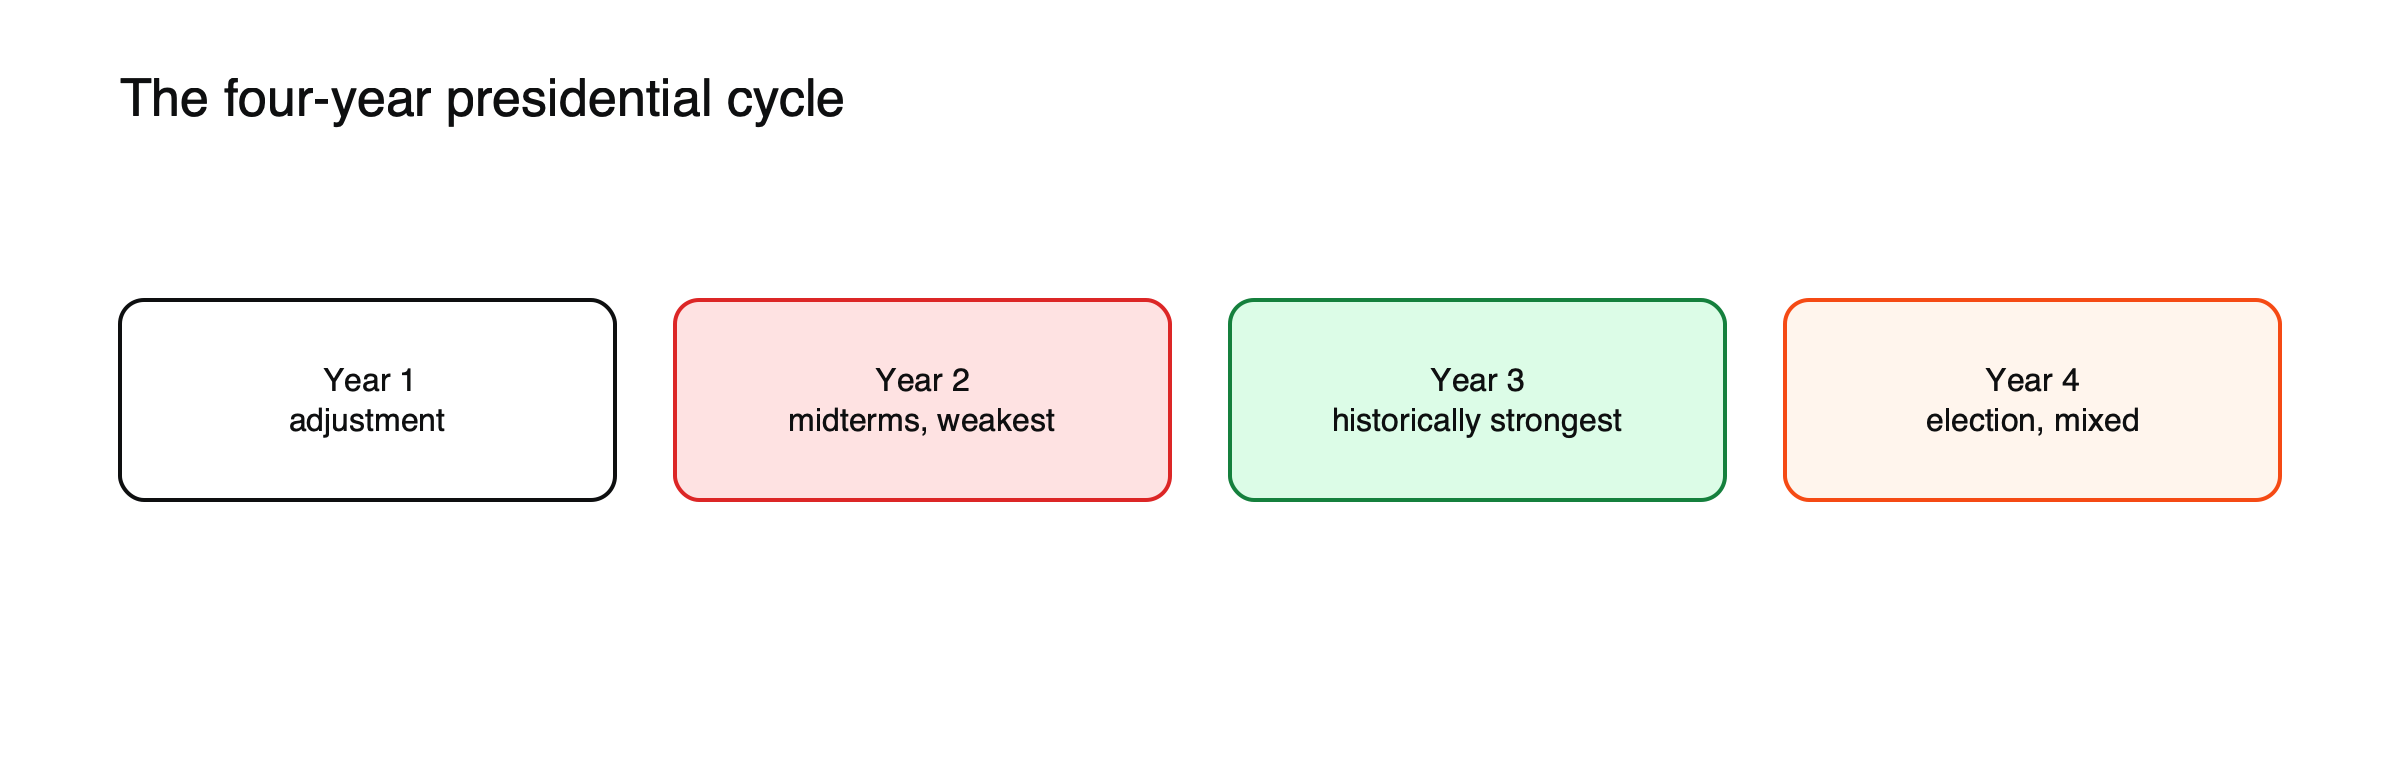
Figure: The four-year presidential cycle as historically described. Small sample; not a forecast.
Why volatility rises before the vote
In the months before an election, investors face uncertainty about taxes, regulation, trade and government spending, and polls can swing. Options prices often build in larger expected moves around election day, and some investors reduce positions or buy protection until the result is known. Once the outcome is clear, part of that uncertainty disappears, whichever side wins, which is why volatility has tended to fade after the vote. The pattern reflects uncertainty itself rather than any particular result.
The four-year presidential cycle
Some analysts track returns across the four years of each presidential term. The idea is that administrations take difficult measures early in a term and try to support the economy ahead of the next election, so the third year has historically been the strongest and the midterm year the weakest. The pattern appears in long-run averages, but individual cycles vary widely, and recessions, wars and financial crises have overridden it many times. It is better treated as background than as a timing tool.
Sectors and policy expectations
Elections can matter more for individual sectors than for the index as a whole. Healthcare companies react to proposals on drug pricing and insurance, energy companies to environmental and drilling policy, banks to regulation, defense contractors to spending plans and companies with large foreign sales to trade policy. As polls shift, these groups can move in opposite directions while the overall index changes little. Sector moves often fade after the election once markets see which proposals become law.
Party control and returns
Investors often assume one party is better for shares than the other, but the long-run record shows that economic conditions, interest rates and earnings have mattered far more than the party in the White House. Divided government, where control of Congress and the presidency is split, is sometimes said to suit markets because it limits large policy changes, but the evidence is mixed and the sample of elections is small.
Election night and the overnight session
US election results usually arrive in the evening and overnight, when the cash stock market is closed. Index futures, and index CFDs priced from them, trade through the night and react to each state’s result. That can produce large overnight swings and gaps at the next morning’s open, sometimes in the opposite direction to the first reaction as more results arrive. Spreads can widen sharply during the night.
An election-night position, illustrated
Suppose a trader holds a US 500 CFD at $5 per point, a $25,000 position with the index at 5,000, with a stop 50 points below the close. (Illustrative figures.) If futures fall 2.5%, about 125 points, during the night as results come in, the stop is filled near that level rather than at 50 points, a loss of about $625 instead of the planned $250. If the market then recovers by the morning open, the position is no longer there to benefit. Many traders reduce size before election night or use guaranteed stops where available. See how stop-loss orders work.
Beyond the United States
Elections elsewhere can move local markets and currencies too, especially when the result is close or a party proposes large changes to taxes, spending or a country’s relationship with trading partners. Currency markets often react first, because they trade around the clock, and domestically focused shares tend to move more than multinationals. See what moves currency prices.
Why the pattern is a weak guide
The worst election years coincided with the Great Depression, the dot-com bust and the 2008 financial crisis: the economy drove returns, not the vote. With only 24 elections since 1928, small samples make neat averages unreliable.
What it means for investors
Treat election years as a source of short-term noise. Earnings, interest rates and recessions have mattered far more. For traders, the practical points are to expect higher volatility in the weeks before the vote, to plan for overnight gaps on election night and to watch sector moves driven by policy expectations. See what happens to stocks in a recession, why markets climb a wall of worry and how long bull markets last.
Midterm elections
Midterm elections, held halfway through a presidential term, decide control of Congress. Historically, the midterm year has been the weakest of the four-year cycle on average, but the months after midterm elections have often been strong, as uncertainty about the balance of power in Washington is resolved. As with presidential elections, the pattern is an average with many exceptions.
Bond markets and the currency
Elections can move bond yields and the dollar as well as shares. Proposals that imply larger budget deficits can push long-term yields higher, while trade policies can move the dollar and the currencies of trading partners. These moves feed back into share prices through valuations and the overseas earnings of large companies, so index traders often watch Treasury yields and the dollar on election night as closely as the index itself.
Polls and prediction markets
Markets react to changes in the expected outcome, not just to the final result. Shifts in polls and in betting or prediction markets can move sectors in the weeks before the vote. When the result matches expectations, the reaction on the day can be muted; a surprise can produce larger moves, at least for a few days.
The down years in context
The four election years in which the S&P 500 fell, 1932, 1940, 2000 and 2008, each coincided with a broader crisis: the Great Depression, the early years of the Second World War, the bursting of the dot-com bubble and the global financial crisis. In each case, the economy and markets were already under heavy pressure, so the election was not the cause of the losses.
A pre-election checklist
- How much is your total exposure, and could it survive an overnight gap?
- Which sectors in your positions are sensitive to policy proposals?
- Are stops placed with election-night liquidity in mind?
- What are bond yields and the currency signaling?
After the inauguration
Once a new administration takes office, attention shifts from campaign promises to actual policy. Proposals on taxes, tariffs, regulation and spending must pass through Congress, and many are changed or dropped along the way. Markets often react more to concrete announcements and legislation in the first months of a term than to the election result itself, as the April 2025 tariff announcements showed when the S&P 500 fell about 19% from its high within weeks.
What the research cannot tell you
Historical studies of election years describe averages across a few dozen elections, each with its own economy, interest rates and global events. They cannot say how any particular election will affect markets, how long a reaction will last or which sectors will benefit. They are useful mainly as a reminder that elections have rarely been the dominant force in long-run returns.
Sizing for election volatility
Because expected moves widen before an election, the same position carries more risk than it did a few months earlier. Reducing value per point as implied volatility rises keeps the money at risk roughly constant. Smaller positions also make it easier to stay calm when headlines swing sharply. See how to size a CFD position using risk per trade.
Common misreadings
- Assuming election years are reliably weak or reliably strong.
- Expecting the winning party to decide market direction.
- Treating a small number of past elections as a dependable statistic.
Frequently asked questions
Do stocks usually fall in election years?
No. The S&P 500 has risen in most presidential election years, although average returns were modestly lower than in other years.
Is volatility higher around elections?
Average volatility has tended to be highest in the one to three months before the vote and to ease once the result is known.
Should I sell before an election?
Selling purely because of an election has not been a reliable strategy. Adjusting position sizes for higher volatility and overnight gaps is a more measured response.
This article is educational content and does not constitute financial, investment, legal or tax advice. Digital assets are volatile and you may lose the amount you invest.
Sources
- How do US elections affect stock market performance? (returns modestly lower in election years; volatility highest one to three months before the vote) — T. Rowe Price, 2024
- Dispelling three election cycle myths (similar returns and volatility in election and non-election years since 1928) — Parametric
- Elections 2024: How stocks perform in election years (Morgan Stanley: positive in 83% of 23 election years; four down years; four-year cycle) — Century Financial
- 2025 index returns and drawdowns (S&P 500 max drawdown −19%) — Charles Schwab, December 2025