
How Market Leadership Rotates From Decade to Decade
Market leaders change as inflation, technology, rates and profit pools change. Sector dominance can persist for years, then reverse when the regime shifts.
Market leadership changes because the economy changes. The sectors with the strongest earnings growth, capital access and investor demand in one era can become mature or overvalued in the next. Inflation, interest rates, technology, regulation and commodity cycles reshape profit pools, so a dominant sector can stay powerful for years without staying dominant forever.
Index leadership is a record of economic change
A market-cap-weighted index automatically gives more weight to companies whose equity values grow.
That makes sector weights a useful historical record.
MSCI’s long-run work on the changing shape of US equities shows how dramatic the shift can be. Energy dominated the oil-shocked economy of the mid-1970s. Industrials became more prominent through the 1990s. Financials grew ahead of the global financial crisis. By 2026, information technology represented roughly 37% of the MSCI USA Index.
That is not only an investing story.
It is a story about where corporate profits, productivity and expectations have moved.
The 1970s rewarded scarcity and inflation exposure
The 1970s were shaped by oil shocks, high inflation and weak real growth.
Energy and commodity-linked businesses had something the rest of the economy desperately needed: scarce physical inputs whose prices were rising.
Companies with direct exposure to oil and raw materials therefore had a different earnings profile from businesses facing higher input costs.
The lesson is broader than “energy wins during inflation.” The market tends to reward the part of the economy that controls the scarce resource in a given regime.
In the 1970s, that scarcity was physical energy. In another decade, it can be computing power, capital, distribution or intellectual property.
The 1980s changed the rate and financial backdrop
Inflation eventually fell from the extremes of the prior decade, interest rates entered a long downward trend and financial markets expanded.
Falling inflation and improving financial conditions changed which cash flows investors were willing to value highly.
Financial firms benefited from a growing capital-markets ecosystem, while consumer and business investment patterns evolved with disinflation.
The important point is not to assign one sector to every calendar decade. Leadership usually changes through transitions. A regime begins to favor a set of businesses before the decade label changes.
The 1990s turned technology into an index-level force
Personal computing, enterprise software, semiconductors and the internet created a genuine investment and productivity boom.
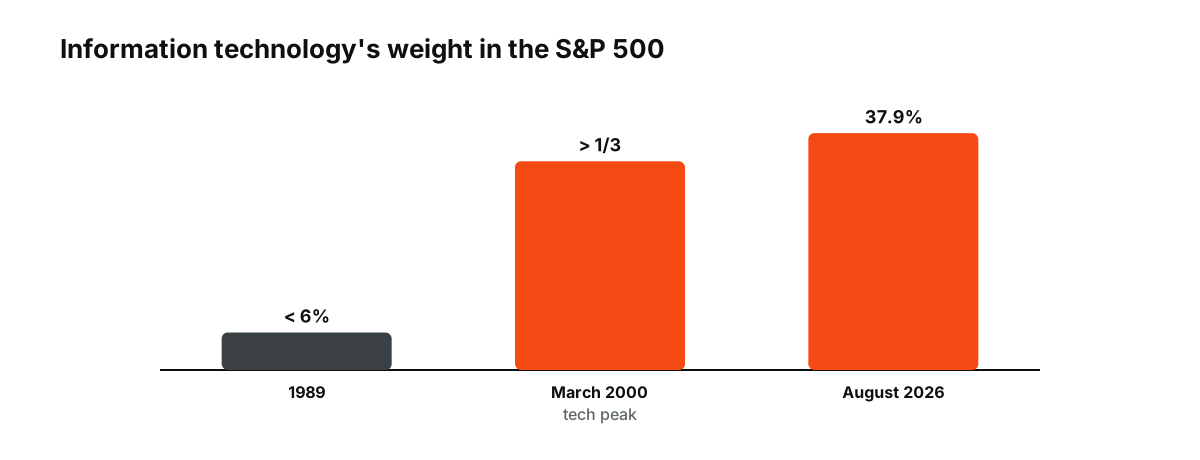
Figure: Information technology’s share of the S&P 500. Sources: S&P data cited in the article; August 2026 figure from S&P Dow Jones Indices.
Information technology’s weight in the S&P 500 rose dramatically. S&P data show the sector at less than 6% of the index in 1989 and above one-third near the March 2000 technology peak.
That increase reflected both fundamentals and valuation.
Some companies became enormously profitable. Others were priced for business models that did not survive.
The sector can therefore be economically transformative and still experience a bubble.
Leadership is not proof that every company in the leading theme is correctly valued.
The 2000s reminded investors that leadership can reverse hard
After the dot-com peak, technology lost its automatic leadership.
The early and mid-2000s instead featured stronger periods for energy, materials and financials as global growth, credit expansion, housing and commodity demand shaped profits.
S&P’s sector-performance data from the period show how different the ranking looked compared with the late 1990s.
Then the global financial crisis broke the financial-sector leadership model.
This is a recurring pattern: a sector can become large because its business model fits the regime, then discover that the same regime has encouraged too much capacity, leverage or valuation.
The 2010s favored scalable, asset-light growth
After the financial crisis, the world entered a long period of low inflation, low interest rates and expanding digital platforms.
Software, cloud computing, smartphones, online advertising and platform economics created businesses that could grow revenue without matching growth in physical capital.
Lower discount rates also increased the present value of distant expected earnings.
Technology and technology-adjacent companies became a larger part of major US indexes.
By the end of the decade, the distinction between “tech sector” and “technology-enabled company” had become blurry. Some of the largest digital businesses sat in communication services or consumer discretionary after sector classifications changed.
The economic theme spread beyond one GICS label.
The 2020s added AI and infrastructure back into the growth story
The current cycle has kept technology leadership powerful while changing its composition.
Artificial-intelligence investment created enormous demand for semiconductors, data centers, networking equipment, power and cooling infrastructure. The growth story therefore became more capital intensive than the software-heavy narrative of the prior decade.
As of August 2026, S&P Dow Jones Indices reported information technology at 37.9% of the S&P 500.
That concentration tells you what has worked. It does not tell you how long it must keep working.
A sector’s growing index weight can reflect superior earnings, higher valuation multiples or both.
Macro regimes help explain why leadership rotates
MSCI research on sectors across different macro regimes finds that sector performance changes with the combination of growth, inflation and interest rates.
The intuition is straightforward.
- Banks care about rates, credit and the yield curve.
- Energy cares about commodity prices and capital discipline.
- Industrials care about investment cycles.
- Consumer businesses care about income and confidence.
- Technology cares about innovation, capital spending and discount rates.
- Defensive sectors often matter more when growth slows.
Leadership changes when the variable that matters most to profits changes.
That is why extrapolating a winning sector indefinitely is risky.
The winner can change even when the theme survives
Technology survived the dot-com crash.
The internet was not a fad. The valuation and company mix were the problem.
Financial services survived 2008. The pre-crisis leverage model did not.
Energy remained essential after the 2014 oil-price collapse. The economics of marginal production changed.
This distinction is useful when a theme becomes crowded. A real structural change can produce both long-term winners and a severe intermediate correction.
You do not have to choose between “the theme is real” and “the market can overprice it.” Both can be true.
Leadership rotation is slow until it suddenly looks obvious
Index weights do not usually flip in a month.
A new leadership regime starts with earnings revisions, relative strength and capital flows. Over years, the compounding creates a market that looks completely different.
That means the most interesting stage is often before a new sector has become a giant percentage of the index.
Signals worth watching include:
- relative earnings growth;
- capital-expenditure trends;
- return on invested capital;
- pricing power;
- sector valuation relative to its own history;
- changes in credit availability;
- shifts in inflation and real rates.
Those variables describe the engine behind leadership rather than the rear-view mirror.
Decades are useful labels, not investment clocks
The market does not reset on January 1 of a year ending in zero.
Decade labels help organize history because the economic regimes often last for years. They should not be treated as fixed seasonal cycles.
The durable lesson is simpler.
Market leadership follows changing profit pools and changing discount rates. A sector can dominate long enough to feel permanent. History shows that permanence is exactly what investors should be careful assuming.
Leadership and index concentration
When one group leads for a long time, it grows to dominate the index. Technology’s rise from a small slice of the S&P 500 in 1990 to close to 40% today is the latest example; financials reached a similar dominance before 2008, and energy companies were among the largest members in earlier decades. Concentration makes the index more dependent on the fortunes of the leaders. See why a handful of stocks can drive an entire index.
Decades at a glance
| Decade | Leaders | Backdrop |
|---|---|---|
| 1970s | Energy, commodities | High inflation |
| 1980s | Consumer, financials | Falling inflation and rates |
| 1990s | Technology, telecom | Productivity boom |
| 2000s | Energy, materials, emerging markets | Commodity boom after tech bust |
| 2010s | Technology, internet platforms | Low rates, slow growth |
| 2020s | Technology, AI infrastructure | Higher rates, AI investment |
(General tendencies; each decade had exceptions.)
What it means for traders
For index traders, knowing which sector leads helps explain how an index behaves: a technology-led index reacts strongly to bond yields and technology earnings, while one led by energy and financials reacts more to oil and the economy. Leadership changes can also shift which indices perform best. See S&P 500 vs Nasdaq 100 and what sector rotation is.
Leadership outside the United States
Other markets have their own leadership patterns, shaped by their sector mix. The FTSE 100 has long been led by energy, mining, banks and consumer staples, the DAX by industrial and export companies, and Japan’s market increasingly by technology hardware and exporters. When global leadership favors commodities or value shares, these markets have often outperformed technology-heavy US indices; when technology leads, the reverse has applied. See what moves stock market indices. Leadership also differs by company size: small caps have led in some recoveries, while large technology companies have dominated the recent decade, a pattern that helps explain why equal-weighted indices have lagged.
Frequently asked questions
Does leadership always change each decade?
No. Leadership can persist for more than a decade, as technology has shown, or change within a few years.
What usually ends a period of leadership?
Overvaluation, rising competition, changes in interest rates or inflation and shifts in the economy’s needs.
This article is educational content and does not constitute financial, investment, legal or tax advice. Digital assets are volatile and you may lose the amount you invest.
Sources
- The Changing Shape of U.S. Equities — MSCI, September 2026
- S&P 500 Sector Performance Matrix — S&P Dow Jones Indices, data through 2024
- Natural Selection: Tactics and Strategy with Equity Sectors — S&P Dow Jones Indices, July 2024
- Factor and Sector Behavior Across Macro Regimes — MSCI, 2024
- S&P 500 — S&P Dow Jones Indices, August 2026 sector weights