
What Moves Natural Gas Prices?
Natural gas moves on weather, storage, production, LNG exports and regional shocks. How each driver works, why US and European prices differ, why it swings.
Natural gas prices move mainly on weather, storage, production, LNG exports and regional supply shocks. Gas is harder to store and ship than oil, so prices are regional and can swing violently. US prices are set at Henry Hub; European prices at the Dutch TTF hub reached about ten times normal levels in 2022.
Weather
Cold winters raise heating demand; hot summers raise power demand for air conditioning. Forecasts can move prices days ahead of the actual weather. See how hurricanes and weather move energy prices.
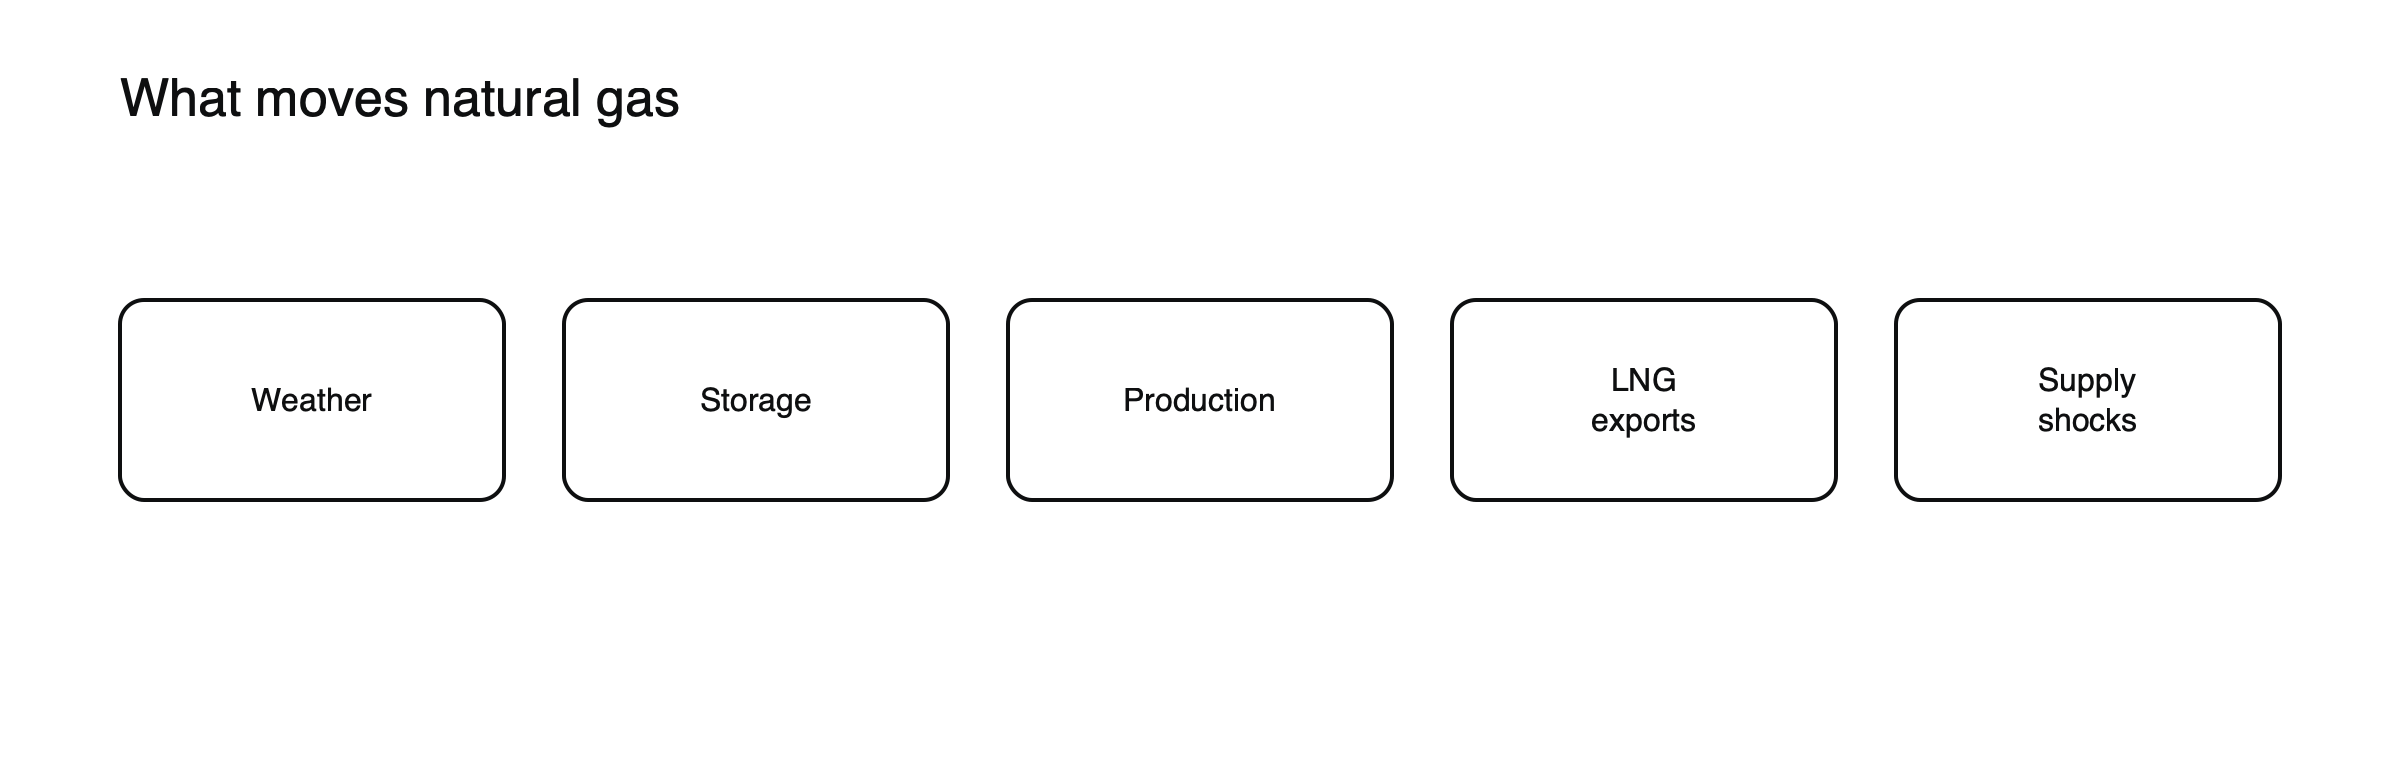
Figure: The main gas drivers.
Storage
The EIA’s weekly storage report, Thursdays at 10:30 a.m. Eastern time, shows whether stocks are building or drawing faster than expected, especially ahead of winter.
Reading the storage report
Suppose analysts expect US storage to rise by 80 billion cubic feet in a summer week, and the report shows an injection of only 60 billion. (Illustrative figures.) Less gas went into storage than expected, implying stronger demand or weaker supply, and prices usually rise. Traders also compare total storage with the five-year average for the same week: a market that is well above average can shrug off a bullish surprise, while one that is below average reacts more strongly.
Heating and cooling degree days
Forecasters measure weather-driven demand using degree days: heating degree days count how much colder than a set temperature each day is, and cooling degree days how much warmer. Rising forecasts of heating degree days in winter, or cooling degree days in summer, point to higher gas use, and traders watch updated forecasts several times a day during extreme weather.
Production
US shale output responds to prices and to oil drilling, since much gas is produced alongside oil.
LNG exports and regional prices
LNG lets gas move between continents, linking US and European prices more than before, but capacity limits keep big regional gaps. Regional US hubs can also trade far from Henry Hub.
Liquefied gas exports in detail
The United States has become one of the world’s largest exporters of liquefied natural gas, sending cargoes to Europe and Asia. Export plants draw large volumes of gas from the US system, so when a plant shuts for maintenance or an outage, US demand drops and Henry Hub prices can fall, while European and Asian prices may rise as cargoes are lost. Export capacity additions work the other way, tying US prices more closely to global demand.
Supply shocks
Pipeline outages, sanctions and plant shutdowns can cause sudden spikes, as in Europe in 2022.
Europe after 2022
After pipeline supplies from Russia were cut in 2022 and prices reached about ten times normal levels, Europe rebuilt its supply around liquefied gas imports and storage. Countries set targets for filling storage before winter, and the speed of filling became a closely watched indicator. European prices remain more sensitive to supply problems than US prices, because the region depends on imports and competes with Asia for cargoes. See oil vs natural gas.
Why gas is so volatile
Demand is weather-driven and storage is limited, so small surprises can produce large price moves. See oil vs natural gas and how commodity CFDs work.
The winter risk window
The months from December to February carry the highest risk of sharp price moves, because heating demand peaks and storage is drawn down. A cold spell early in winter can raise fears that storage will run low before spring, lifting prices far beyond the immediate demand. Mild winters do the reverse, leaving storage high and prices weak. Traders therefore follow long-range temperature outlooks closely from late autumn.
Drivers by time horizon
| Horizon | Main drivers |
|---|---|
| Hours to days | Weather forecasts, storage report, plant outages |
| Weeks | Temperature trends, LNG export flows, production changes |
| Months | Storage levels against average, seasonal demand, new export capacity |
| Years | Drilling investment, export growth, energy policy |
Trading gas CFDs
Natural gas CFDs usually follow the front-month Henry Hub futures contract and roll monthly, often across a curve with strong seasonal shape, so roll adjustments can be large around the change from summer to winter contracts. Under EU retail rules they carry a 10:1 leverage cap, and daily moves of 5% or more are common, so a typical position needs to be smaller than an oil position of similar value. See how a futures roll adjusts a commodity CFD price.
A cold snap, illustrated
Suppose forecasts in early January suddenly show two weeks of colder-than-normal weather across the eastern United States. (Illustrative scenario.) Expected heating demand jumps, and traders estimate that storage could fall well below its five-year average by the end of winter. Henry Hub futures rise 15% in three days. A week later, forecasts turn milder and half the gain disappears. The real weather had barely changed; the forecasts had. Gas prices often move this way, on expectations days or weeks ahead of actual demand.
Regional prices within the US
Henry Hub is the main US benchmark, but prices at other hubs can differ widely. Regions with limited pipeline capacity, such as parts of New England, can see prices spike far above Henry Hub during cold weather, while regions with abundant local production and limited ways to ship it out can trade at deep discounts. These gaps show that even within one country, gas is a regional market shaped by pipelines.
Switching between gas and coal
Power generators that can burn either gas or coal choose the cheaper fuel. When gas prices fall, more electricity is generated from gas, which supports demand; when they rise, some generators switch to coal, which caps demand. This switching acts as a partial stabilizer for gas prices, though it has weakened as coal plants have closed in many countries.
A gas checklist
- What do temperature forecasts show for the next two weeks?
- Where is storage compared with the five-year average?
- Are liquefied gas export plants running normally?
- Is production rising or falling?
Common misreadings
- Treating US and European gas as the same market.
- Reacting to one forecast update as if it were final.
- Sizing gas positions like oil positions.
Long-term contracts and spot prices
Much of the gas traded internationally is sold under long-term contracts, some linked to oil prices and others to hub prices such as Henry Hub or TTF. Spot cargoes and hub trading set marginal prices and react fastest to news. When spot prices spike, buyers with long-term contracts are partly protected, while those relying on spot purchases face the full increase. The share of gas sold at hub prices has grown, which has made regional prices more responsive to short-term supply and demand.
Gas and oil, linked and separate
In some regions, especially parts of Asia, long-term gas contracts have been priced with reference to oil, so oil moves feed into gas costs with a delay. In the United States and Europe, hub prices largely set their own course, driven by weather and storage, and can move very differently from oil for long periods. See oil vs natural gas. For traders, the practical point is to check which benchmark a gas CFD follows and which of these forces matters most for that market. Henry Hub and TTF can tell very different stories.
Frequently asked questions
Why can gas prices jump on a weather forecast?
Because demand depends heavily on temperature and storage is limited, a forecast of colder or hotter weather quickly changes expected demand and the risk of shortages.
Do US and European gas prices move together?
Partly, through liquefied gas trade, but they often diverge because Europe depends on imports while the US produces more than it uses.
This article is educational content and does not constitute financial, investment, legal or tax advice. Digital assets are volatile and you may lose the amount you invest.
Sources
- What’s new: release schedules (Weekly Petroleum Status Report after 10:30 a.m.; Weekly Natural Gas Storage Report Thursday 10:30 a.m.; Cushing stocks; refinery utilization) — US EIA
- Europe’s energy crisis (gas reached about ten times normal levels in 2022) — Foreign Policy, August 2022
- New England natural gas prices near record discounts to Henry Hub (regional hubs vs the US benchmark) — US EIA
- ESMA adopts CFD measures (gold 20:1; commodities other than gold 10:1) — Finadium