
How to Calculate Profit and Loss on a Bitcoin CFD
Bitcoin CFD P&L = (exit − entry) × coins, reversed for shorts, minus spread and financing. Examples: a 0.1 BTC long nets about $264; a 2 ETH short loses $600.
Bitcoin CFD profit and loss is the price change times coins: P&L = (exit − entry) × coins for a long, reversed for a short, minus spread and financing. A 0.1 BTC long from $60,000 to $63,000 gains $300 gross; after 10 days of financing at about $2.96 a day and a $6 spread, the net is about $264.
The formula
- Gross P&L = price change × coins (direction-adjusted)
- Net = gross − spread − financing
Worked example 1: bitcoin long
- Buy 0.1 BTC at $60,000; sell at $63,000
- Gross: 3,000 × 0.1 = +$300
- Financing: 10 days × $2.96 ≈ $29.60 (18% annual rate on $6,000)
- Spread: $6
- Net: ≈ +$264.40
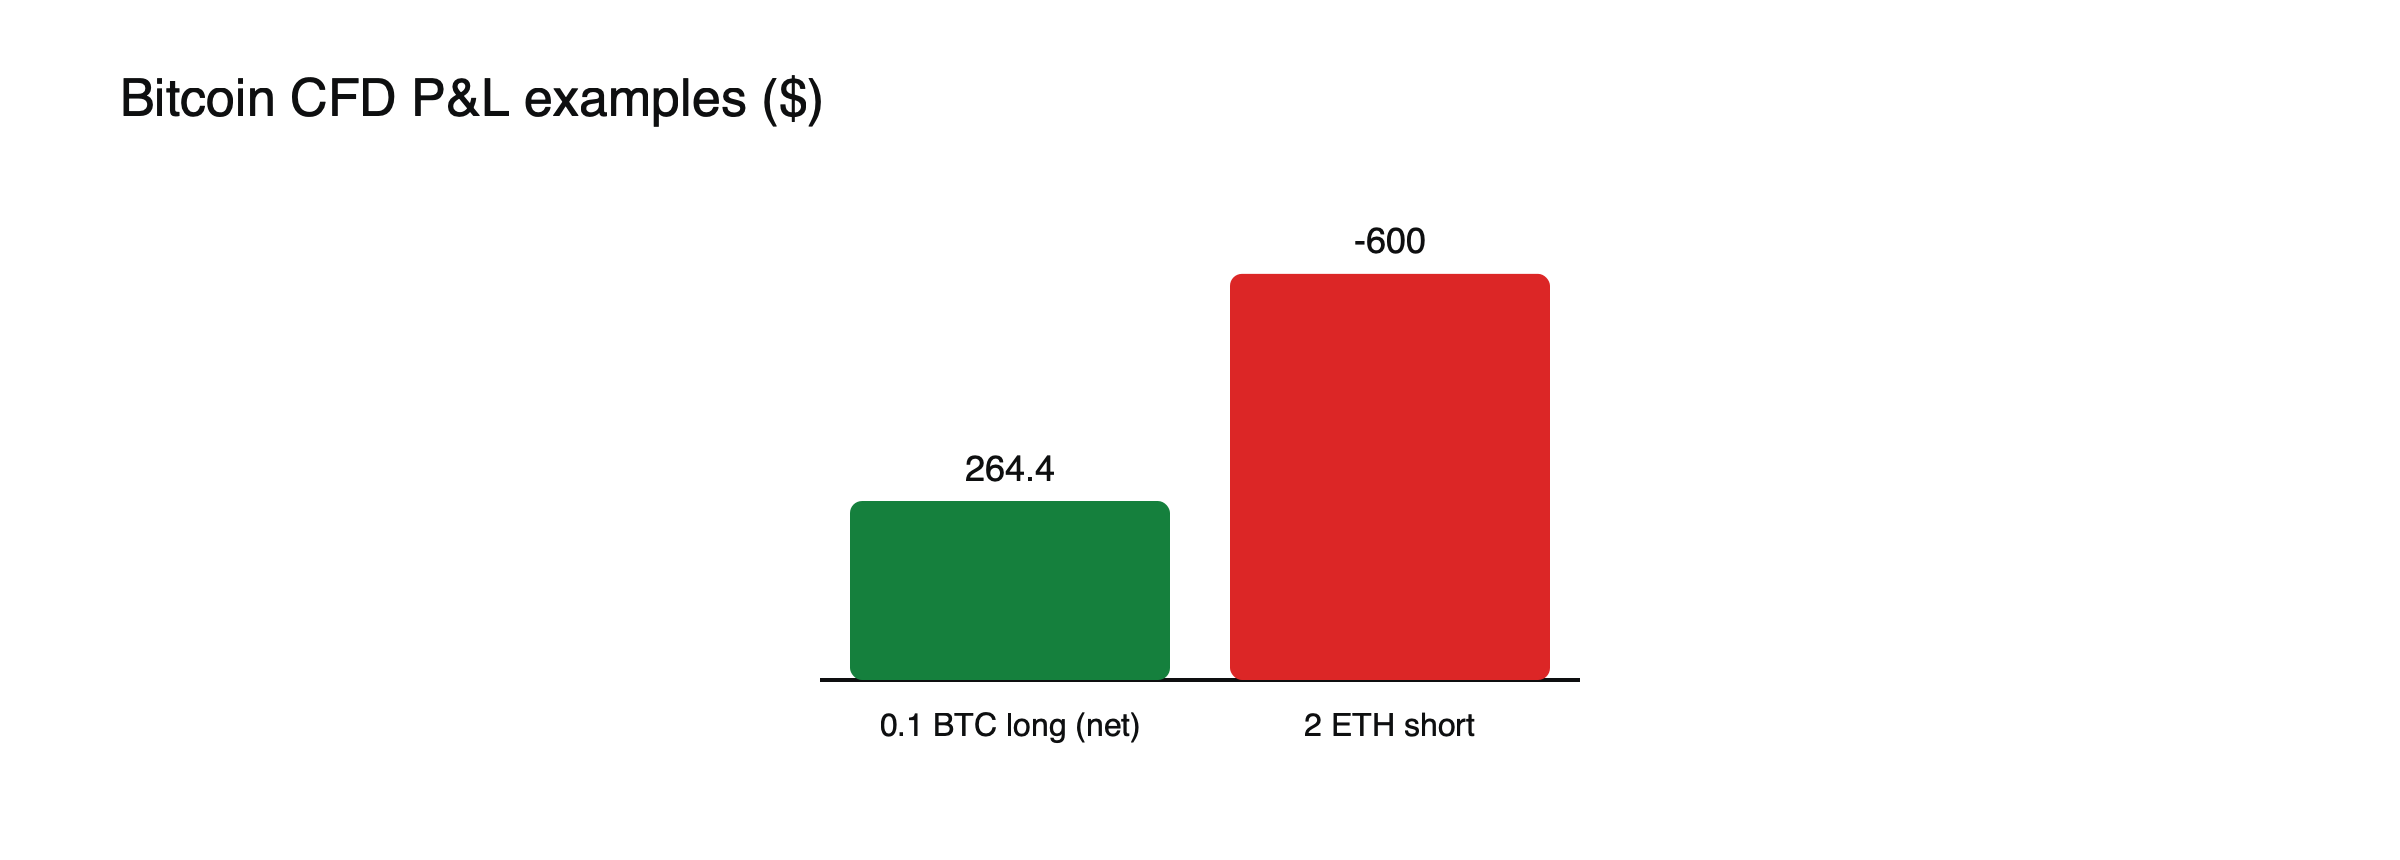
Figure: The two worked examples (example values).
Worked example 2: ether short
- Sell 2 ETH at $3,000; ether rises to $3,300
-
Gross: (3,000 − 3,300) × 2 = −$600
-
Financing: 10 days at 18% on a $6,000 position ≈ $29.59
- Spread: $6
- Net: ≈ −$635.59
Worked example 3: a winning bitcoin short
- Sell 0.1 BTC at $60,000; buy back at $57,000 five days later
- Gross: (60,000 − 57,000) × 0.1 = +$300
- Financing on the short: 5 days at 18% ≈ $14.79, if the provider charges shorts
- Spread: $6
- Net: ≈ +$279.21
(Example values.)
The break-even price
Costs mean a long needs to rise some way before it shows a profit. In example 1, the spread and ten days of financing total about $35.60. On 0.1 BTC, that is $356 per coin, so the break-even exit is about $60,356, not $60,000. Calculating the break-even before entering shows how far the price must move just to cover costs, which matters more the longer a position is held.
Converting currencies
If your account is in euros, convert the dollar result at the current rate; currency moves change the outcome.
Currency conversion, worked through
If the account is in euros and EUR/USD is 1.10 when the long in example 1 is closed, the $264.40 net gain converts to about €240. If the euro had strengthened during the trade, the same dollar gain would be worth fewer euros. Most platforms convert automatically at their own rate, which may include a small conversion fee.
Checking against margin
The long used $3,000 of margin at 2:1; the $264 net gain is about 8.8% of margin, while a 5% fall in bitcoin would have cost about $300 before costs. See how volatility changes the margin on a crypto CFD, how much it costs to hold a bitcoin CFD and what a crypto CFD is.
Return on margin versus return on position
The long in example 1 gained about 4.4% on the $6,000 position after costs, but about 8.8% on the $3,000 of margin committed. Leverage doubles the percentage outcome in both directions. Measuring results against the margin used, and against the whole account, gives a more honest picture of risk than looking at the position alone.
Unrealized and realized profit
While a position is open, its profit or loss is unrealized and changes with every price move; it becomes realized when the position is closed. Platforms usually show unrealized P&L at the price at which the position could be closed, the bid for longs and the ask for shorts, so it already reflects the spread. Financing charges are deducted as they occur.
Profit in fast markets
In fast markets, the price at which a position actually closes can differ from the price on screen, especially for stops and market orders. A long expected to close at $63,000 might fill at $62,800 in a sudden drop, reducing the gain by $20 on 0.1 BTC. Allowing for some slippage in calculations avoids overestimating results.
Keeping track
Recording each trade’s entry, exit, size, spread, financing and currency conversion in a simple spreadsheet makes it easy to check the platform’s figures and to see how much of total results is consumed by costs.
Worked example 4: a smaller coin
- Buy 1,000 coins at $2.00, a $2,000 position
- Sell at $2.30 seven days later: gross +$300
- Spread: $0.01 per coin = $10
- Financing: 7 days at 18% on $2,000 ≈ $6.90
- Net: ≈ +$283.10
(Example values.) The same formula applies to any coin; only the size, price and costs change.
Partial closes
Traders often close part of a position at a first target and let the rest run. Suppose 0.1 BTC is bought at $60,000; half is closed at $63,000, gaining $150, and the other half at $61,000, gaining $50. The total gross gain is $200. Each part’s profit is calculated on its own size, and financing applies only to the coins still open each night.
Average entry after adding
If a trader buys 0.05 BTC at $60,000 and adds 0.05 BTC at $62,000, the average entry is $61,000 for the full 0.1 BTC. Closing everything at $63,000 gains 0.1 × $2,000 = $200: $150 on the first half and $50 on the second. Platforms usually show the average price, but checking it by hand confirms how each addition changed the break-even level.
A P&L checklist
- Direction, size in coins and entry price
- Exit price, including any slippage
- Spread paid
- Financing for each night held
- Currency conversion, if any
Common misreadings
- Treating gross P&L as the result.
- Forgetting that adding to a position moves the break-even price.
Profit as a share of the account
A $264 gain looks different depending on the account behind it. On a $3,000 account, it is almost 9%; on a $30,000 account, under 1%. Measuring results as a share of the whole account, rather than of the position or the margin, shows how much each trade really moves your overall capital and keeps risk decisions consistent.
When losses close the position
If a loss pushes the account’s margin level down to the close-out threshold, the provider closes positions automatically. The realized loss is then calculated at the closing price, which may be worse than the threshold in a fast market. Knowing in advance the price at which this would happen is part of calculating potential loss, not just potential profit. See how volatility changes the margin on a crypto CFD.
Taxes
Profits and losses on CFDs may be taxed differently from gains on directly held crypto, depending on the country. Keeping records of gross results, costs and currency conversions makes tax reporting easier and more accurate.
Comparing results across trades
To compare trades fairly, express each result as a percentage of the account at the time and as a multiple of the amount risked. A trade that gained $300 while risking $100 returned three times its risk; one that gained $300 while risking $600 returned only half. Over many trades, the ratio of average gain to average loss, together with the share of winning trades, shows whether a strategy is working better than any single result can. Tracking these figures in a journal over months gives a clearer picture of performance than memory or recent results alone.
Frequently asked questions
Does a short position earn financing?
Usually not on crypto CFDs; many providers charge financing on shorts as well as longs. Check the provider’s rates.
Why does my P&L show a loss right after opening?
Because the position is valued at the price you could close at, so the spread appears as an immediate small loss.
Leverage, margin and cost figures in this article are example values for illustration. Actual terms depend on the provider, the instrument and the rules in your country.
This article is educational content and does not constitute financial, investment, legal or tax advice. Digital assets are volatile and you may lose the amount you invest.