
Funding Rates vs Overnight Financing
Perpetuals use funding between longs and shorts every 8 hours; CFDs charge overnight financing set by the provider. How each works and how the costs compare.
Funding rates and overnight financing are two ways of charging for leveraged crypto positions over time. On perpetuals, funding passes between traders, usually every 8 hours: longs pay shorts when the contract trades above spot, and the reverse below. On CFDs, the provider charges overnight financing on the position’s value.
Side by side
| Perpetual funding | CFD overnight financing | |
|---|---|---|
| Who receives it | Traders on the other side | The provider |
| How often | Usually every 8 hours | Daily, at a cut-off time |
| What sets it | Perpetual price vs spot, plus an interest component | Provider’s benchmark plus markup |
| Direction | Can be paid or received | Usually a cost, especially for crypto |
| Typical baseline | 0.01% per 8 hours on many exchanges | Varies widely by provider |
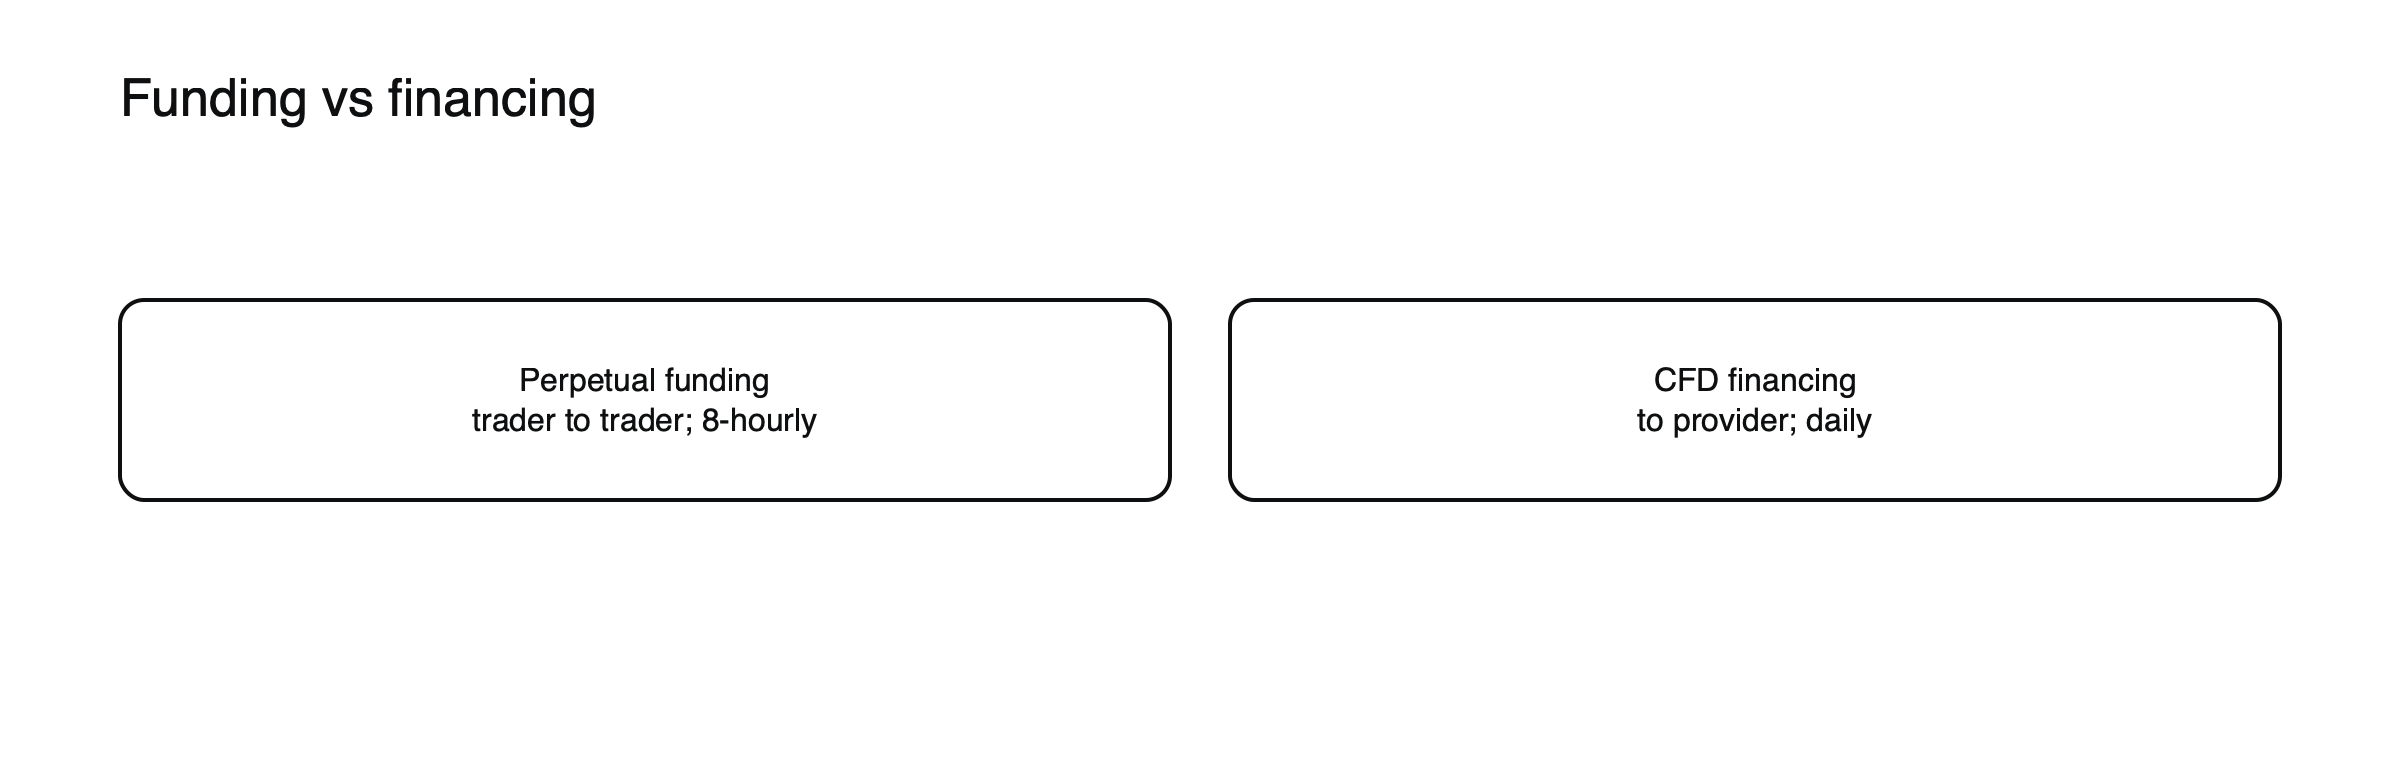
Figure: Two ways to charge for holding.
Worked comparison
At the common baseline of 0.01% per 8 hours, funding costs a long about 0.03% a day, roughly 11% a year, if the rate stays at baseline. Funding has been positive most of the time on major exchanges, but spikes in euphoric markets. A CFD with an 18% annual financing rate costs about 0.05% a day.
A month compared, illustrated
On a $6,000 long bitcoin position held for 30 days:
| Scenario | Perpetual funding | CFD financing at 18% |
|---|---|---|
| Baseline funding, 0.01% per 8 hours | About $54 paid | About $89 |
| Euphoric market, 0.05% per 8 hours | About $270 paid | About $89 |
| Fearful market, −0.01% per 8 hours | About $54 received | About $89 |
(Illustrative rates.) The CFD’s cost is the same in every scenario; the perpetual’s ranges from a payment to a large charge, depending on market mood.
How funding is calculated
Funding on perpetuals usually combines a premium component, based on how far the perpetual’s price trades above or below spot, and a small interest component. Many exchanges cap each funding payment, commonly at around ±0.05% per period. When many traders want to be long, the perpetual trades above spot, funding rises and longs pay shorts, which encourages arbitrage that pulls the price back toward spot.
How CFD financing is calculated
CFD financing is set by the provider, usually as an annual rate applied to the position’s value each night: position value × rate ÷ 365. For crypto, providers often use a fixed rate rather than a market interest rate plus a markup. The rate changes only when the provider updates it, which makes costs easier to plan.
Which is cheaper?
It depends on market conditions and the provider. Funding can turn negative and pay longs; CFD financing is more predictable. See how much it costs to hold a bitcoin CFD for a month.
When the cheaper route costs more
“Perpetuals are cheaper” ignores liquidation risk and higher leverage, which can cost far more than financing.
See what the funding rate is, crypto CFDs vs crypto futures and perpetuals and what a crypto CFD is.
Short positions
On perpetuals, shorts receive funding when it is positive, which has been most of the time on major exchanges, so holding a short can earn income in calm or bullish markets. On CFDs, shorts often pay financing too, because providers charge both sides for crypto. This difference makes perpetuals relatively attractive for shorts and CFDs relatively expensive.
Funding as a market signal
Because funding reflects how eager traders are to be long or short, many watch it as a sentiment gauge. Funding has been positive about 92% of the time on BitMEX, but very high funding often signals crowded, leveraged long positions, which can unwind sharply. Negative funding often appears after sell-offs, when shorts are crowded. See what the funding rate is.
Planning around costs
For CFDs, the monthly cost can be calculated in advance. For perpetuals, it can only be estimated from recent funding history, and it can change every few hours. Traders holding for weeks on perpetuals should monitor funding regularly and be ready to close if it turns expensive.
Funding in a frenzy, illustrated
Suppose bitcoin rallies sharply and funding hits a cap of 0.05% per eight hours for three days. (Illustrative scenario.) A long perpetual position of $6,000 pays about $27 in funding over those three days, while a CFD at 18% would cost about $9. If the frenzy lasts weeks, the gap grows quickly. Conversely, in a sell-off with negative funding, the perpetual long would be paid while the CFD long keeps paying.
Costs beyond funding and financing
Holding costs are only part of the picture. Perpetuals often have low trading fees but can carry liquidation fees and wider effective spreads in fast markets. CFDs bundle most trading costs into the spread. Comparing total costs, including entry, exit and holding, gives a fairer picture than comparing funding and financing alone.
Short trades
For short trades of a day or two, holding costs are usually small on both routes, and spreads, fees and slippage matter more. For holds of weeks, financing and funding become the dominant costs, and their different behavior matters most.
Regulation and transparency
CFD financing rates are published by regulated providers and apply under rules that include retail protections in many jurisdictions. Funding rates on exchanges are public and calculated by formula, but the exchanges themselves vary widely in regulation. Transparency of the rate does not remove venue risk.
Common misreadings
- Assuming baseline funding will last.
- Comparing an annual CFD rate with a per-period funding rate without converting.
Converting the rates, worked through
To compare like with like, convert both to the same period. Funding of 0.01% every eight hours is 0.03% a day, about 10.95% over a year if it never changes. CFD financing at 18% a year is about 0.049% a day, or about 0.016% per eight-hour period. At baseline funding, the perpetual is cheaper; once funding exceeds about 0.016% per period, the CFD becomes the cheaper option for a long. (Illustrative rates.)
Which suits whom
Traders who value predictable costs and regulated access, and who hold positions for days rather than months, often prefer CFDs despite higher baseline rates. Traders comfortable with exchange risk and able to monitor funding closely may find perpetuals cheaper in calm markets, and attractive for short positions when funding is positive.
A cost-planning routine
- Estimate the holding period.
- Calculate CFD financing for that period.
- Check recent funding history, not just today’s rate.
- Add spreads, fees and likely slippage.
- Compare the totals and the risks, not only the costs.
Why two systems exist
Perpetual futures were designed for crypto exchanges that needed a way to keep a contract without expiry close to the spot price. Funding solves that by rewarding whichever side helps pull the price back toward spot. CFDs grew out of traditional finance, where providers charge for the cost of carrying a leveraged position overnight. The two approaches reflect different market structures, which is why they behave so differently in calm and stressed markets.
Mixing the two
Some traders use both: CFDs for regulated, predictable exposure and perpetuals for short-term trades when funding is favorable. Doing so requires carefully tracking costs and risks on two very different platforms, including separate margin rules and liquidation mechanics, and adding up total exposure across both so that the combined position does not exceed the intended risk.
Frequently asked questions
Do I pay funding if I close before the funding time?
On most exchanges, funding is paid only by positions open at the funding time, usually every eight hours.
Why is CFD financing usually higher than baseline funding?
Because the provider charges for hedging costs and risk, while baseline funding reflects only a small interest component in calm markets.
Leverage, margin and cost figures in this article are example values for illustration. Actual terms depend on the provider, the instrument and the rules in your country.
This article is educational content and does not constitute financial, investment, legal or tax advice. Digital assets are volatile and you may lose the amount you invest.