
How to Calculate the Value of a Point on an Index CFD
P&L = points moved × value per point; position value = index level × value per point. Worked examples on a US index at 5,000 and a European index in euros.
On an index CFD, you choose the value per point, and the rest follows: P&L = points moved × value per point and position value = index level × value per point. At $2 per point, a 50-point move is $100, and with the index at 5,000 the position is worth $10,000. Convert if priced in another currency.
The formulas
- Profit or loss = (exit − entry) × value per point (reverse for shorts)
- Position value = index level × value per point
- Margin = position value × margin rate (5% at 20:1)
Worked example 1: US index at 5,000
- Value per point: $2 (example value)
- Position value: 5,000 × $2 = $10,000
- Margin at 20:1: $500
- Index rises 50 points: profit = 50 × $2 = $100
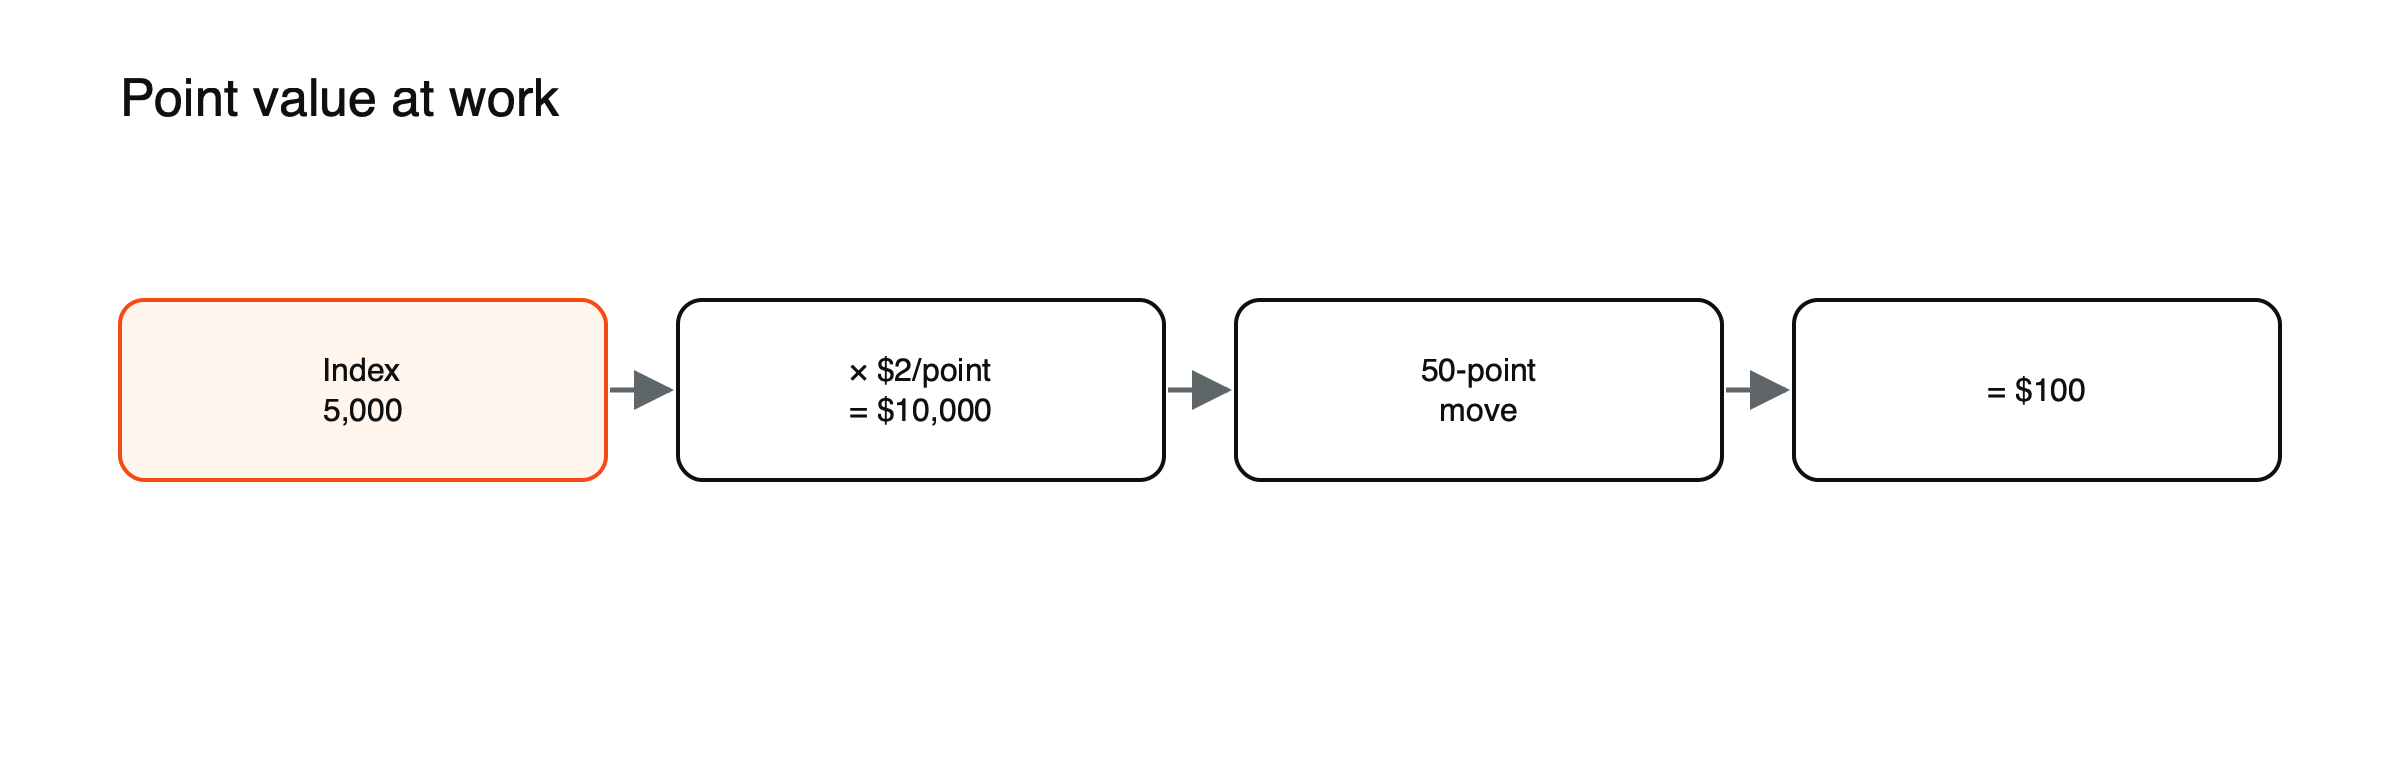
Figure: From point value to profit (example values).
Worked example 2: European index at 18,000
- Value per point: €1
- Position value: €18,000; margin at 20:1: €900
- Index falls 120 points: loss = €120
- For a dollar account at EUR/USD 1.10: about $132
Worked example 3: an account in pounds
A trader with an account in pounds buys a US index CFD at 5,000 at $2 per point. The index rises 75 points, a gain of $150. At GBP/USD 1.27, that is about £118. If the pound strengthened to 1.33 while the position was open, the same $150 would be worth only about £113. For non-dollar accounts, point values in other currencies carry an extra currency exposure. (Illustrative figures.)
Worked example 4: the same risk on two indices
Suppose a trader wants to risk $200 on each of two trades. On a US index, the stop is 40 points away, so the size is $200 ÷ 40 = $5 per point. On a European index priced in euros, the stop is 150 points away because the index level and its daily moves are larger, so the size is €200 ÷ 150 ≈ €1.33 per point, converted at the exchange rate for a dollar risk of about $200. The point values differ widely, but the risk is the same. (Illustrative figures.)
Why point value matters
Indices at higher levels make each contract larger: €1 per point on an index at 18,000 is a bigger position than $1 on one at 5,000. Compare by position value, not by point value alone.
Sizing from risk
Choose value per point so that the distance to your stop costs only what you accept: $100 risk ÷ 40-point stop = $2.50 per point. See how to size a CFD position using risk per trade, how to calculate pip value and how stock index CFDs work.
Minimum sizes and contract units
Providers set minimum trade sizes, often a fraction of a unit per point, and some define index CFDs in contracts with a fixed value per point rather than a free choice. A provider might quote one contract as $10 per point, with a minimum of 0.1 contracts, so the smallest position is $1 per point. Checking how the provider defines a contract avoids accidentally trading ten times the intended size.
Point value and typical daily moves
Comparing the value per point with an index’s typical daily range shows how much a normal day can cost. If a US index often moves 50 points a day, a $5-per-point position swings about $250 on an ordinary day; on a volatile day with a 150-point move, it swings $750. Knowing these figures before opening a position keeps daily swings in proportion to the account.
Common errors
- Treating point values on different indices as comparable without converting to position value.
- Forgetting currency conversion for indices priced in euros, pounds or yen.
- Confusing a provider’s contract size with value per point.
Margin across indices, illustrated
| Index CFD | Level | Value per point | Position value | Margin at 20:1 |
|---|---|---|---|---|
| US 500 | 5,000 | $2 | $10,000 | $500 |
| Germany 40 | 18,000 | €1 | €18,000 | €900 |
| UK 100 | 8,000 | £1 | £8,000 | £400 |
| Japan 225 | 38,000 | ¥100 | ¥3,800,000 | ¥190,000, about $1,267 at 150 yen |
(Illustrative levels.) The same nominal “one unit per point” means very different amounts of money across indices, which is why comparing position values, not point values, gives a true picture of size.
Point value and spreads
The spread is also paid in points. A 0.5-point spread on a $2-per-point US index position costs $1; a 1.5-point spread on a €1-per-point German index position costs €1.50. Converting spreads into money at your chosen point value shows the true cost of each trade, especially for frequent short-term trading.
Scaling in and out
Because point value can be set in small increments, traders can build or reduce positions in steps, for example opening at $1 per point and adding another $1 if the market confirms the idea, or closing half at a first target. Each step changes the total value per point, so recalculating the money at risk to the stop after each change avoids drifting into a larger position than planned.
Point value and opening gaps
A stop 40 points away limits risk to 40 times the point value only if the market trades through each price. If an index opens 120 points lower after overnight news, a $5-per-point long loses about $600 rather than the planned $200. Choosing point value with the possibility of opening gaps in mind, especially before major news, keeps those surprises survivable.
Value per point and leverage
Dividing position value by account equity gives effective leverage. A $10,000 US index position on a $5,000 account is 2 times leverage; at $10 per point, the same index would be a $50,000 position and 10 times leverage. Effective leverage, not the maximum allowed, determines how much a market move affects the account. Keeping it modest leaves room for the gaps and volatile days that indices regularly produce. See leverage in CFD trading.
A sizing checklist
- What is the distance to the stop in points?
- How much are you willing to lose, in your account currency?
- What value per point does that imply, after currency conversion?
- What position value and effective leverage result?
- Could an opening gap exceed the stop distance?
Converting points to percentages
Points are easier to compare when converted into percentages of the index level. A 50-point move on an index at 5,000 is 1%; a 180-point move on an index at 18,000 is 1%. Thinking in percentages, then converting to points for each index, keeps stop distances and targets consistent across markets with very different levels.
Frequently asked questions
Is a point the same as 1% of the index?
No. A point is one unit of the index level. At 5,000, one point is 0.02%; at 18,000, it is about 0.0056%.
Why do some indices have very large point moves?
Because their levels are high. An index at 38,000 can move several hundred points on an ordinary day, which is a similar percentage move to a few dozen points on an index at 5,000.
Leverage, margin and cost figures in this article are example values for illustration. Actual terms depend on the provider, the instrument and the rules in your country.
This article is educational content and does not constitute financial, investment, legal or tax advice. Digital assets are volatile and you may lose the amount you invest.