
What Was Volmageddon?
On February 5, 2018, the VIX jumped a record 20 points and short-volatility products such as XIV collapsed. What happened, why and the lessons for traders.
Volmageddon is the name for February 5, 2018, when the VIX jumped a record 20 points in a day, more than doubling to 38.80. Products betting on calm markets by shorting volatility, most famously XIV, collapsed, and the S&P 500 fell more than 10% from its high in two weeks, ending a long period of calm.
Timeline
- 2017–January 2018: the VIX spends long stretches near record lows around 9–11; short-volatility products attract heavy inflows.
- Late January: stocks start to fall; the VIX rises to about 17.
- February 5: the VIX closes at 38.80, a record one-day jump of 20 points.
- February 6: it touches 50; XIV and similar products collapse and are later shut down.
- January 26–February 9: the S&P 500 falls more than 10% from its high.
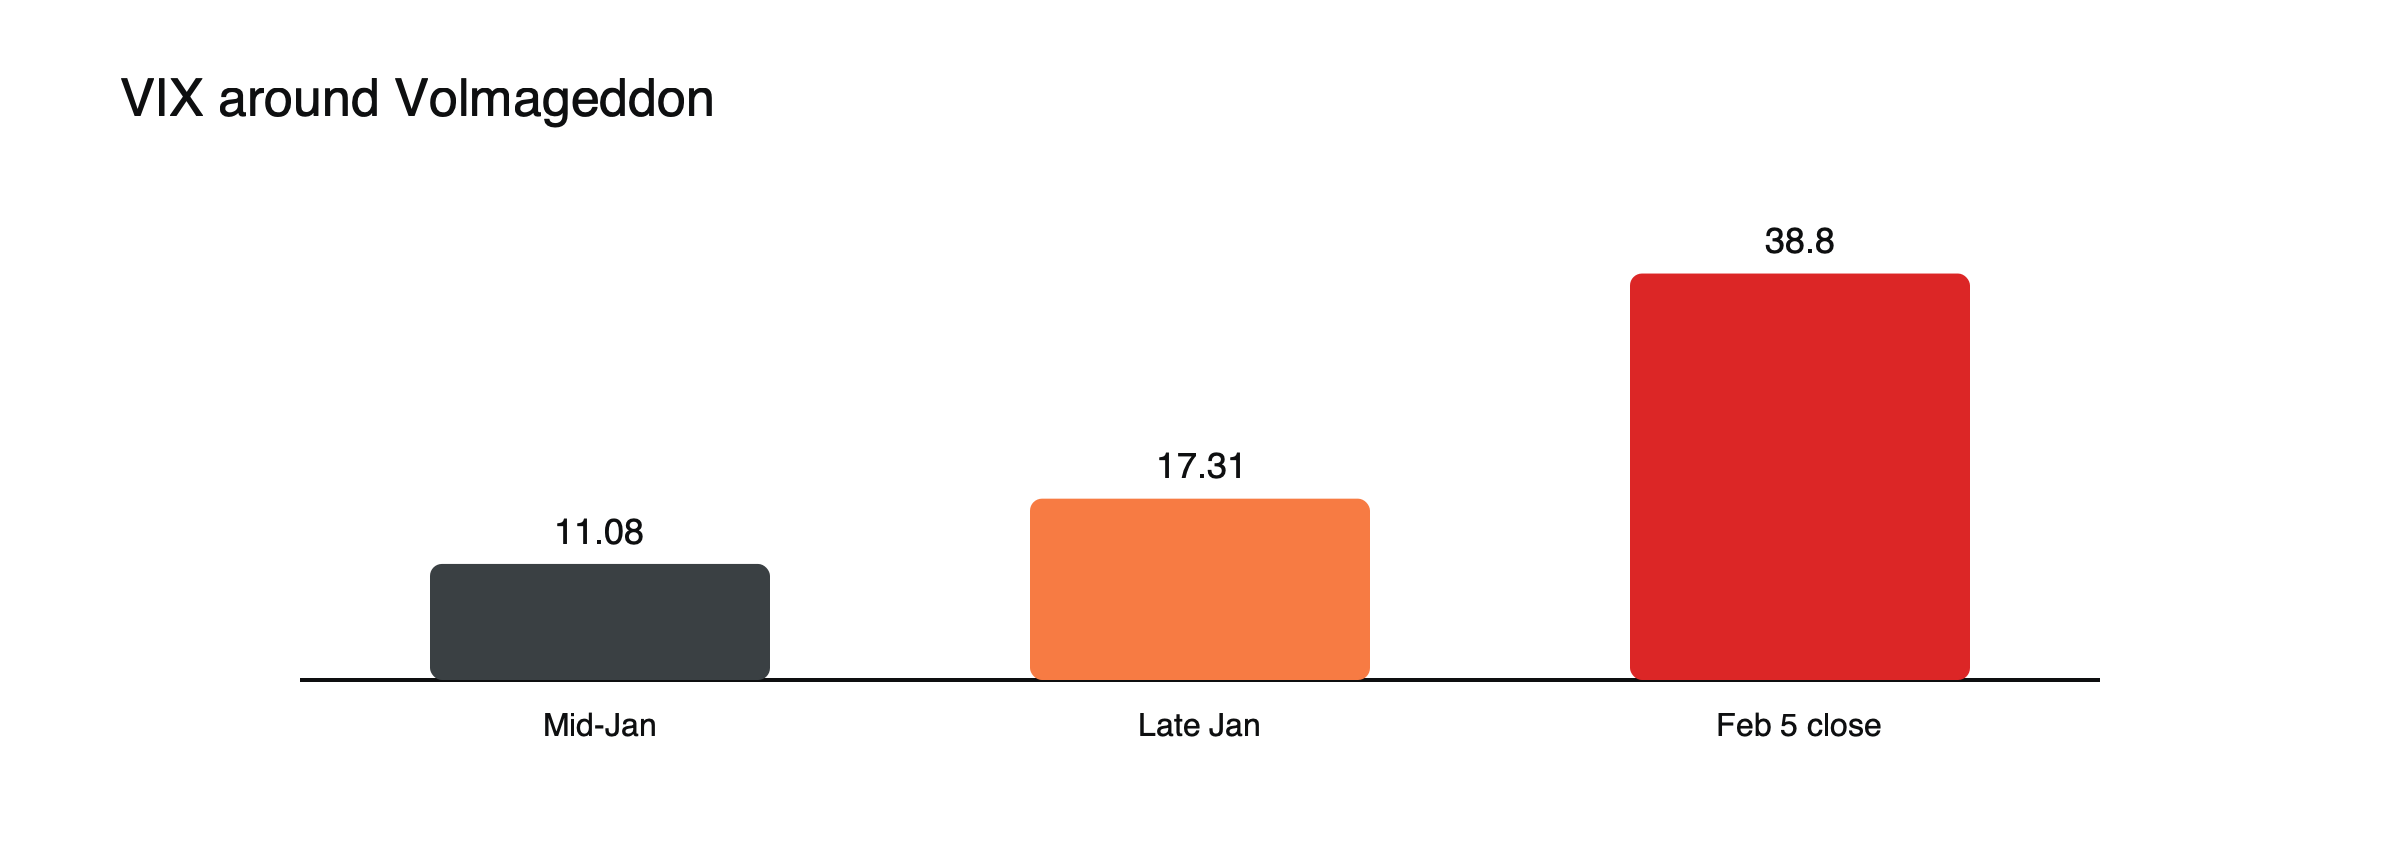
Figure: The VIX more than doubled in a day. Source: IBKR Campus.
Why it happened
Crowded short-volatility trades: many investors were earning steady income by selling volatility.
Feedback loop: inverse-VIX products had to buy VIX futures as volatility rose, pushing it higher still, while liquidity was thin.
How an inverse volatility product worked, illustrated
XIV aimed to deliver the inverse of the daily move in short-term VIX futures. If those futures rose 10% in a day, XIV was designed to fall about 10%; if they fell 10%, XIV rose about 10%. (Simplified.) Through 2017, as volatility stayed low and futures drifted down, the product rose strongly. But a single day in which VIX futures roughly doubled meant a loss approaching 100%. On February 5, 2018, futures jumped by about that much, and XIV lost almost all its value after the close. Its terms allowed the issuer to close it after such a loss, and it was shut down.
The rebalancing loop
To keep their exposure in line with their targets, inverse and leveraged volatility products rebalanced at the end of each day. After a big rise in volatility, inverse products had to buy VIX futures near the close to reduce their short exposure, at the moment futures were already soaring. Because these products had grown large, their buying pushed futures higher still, reinforcing the spike. Market participants had warned of this feedback loop before it happened.
Who was affected
Holders of short-volatility products lost almost everything; volatility-targeting funds cut stock exposure, adding to selling.
Volatility-targeting funds
Some funds adjust their stock exposure to keep portfolio volatility steady: they hold more shares when markets are calm and fewer when volatility rises. When volatility doubled in February 2018, these funds sold shares, adding to the decline in the S&P 500. Similar dynamics have appeared in later sell-offs, showing how strategies tied to volatility can turn a rise in volatility into extra selling of shares.
After the event
Several short-volatility products were closed, and issuers and regulators paid more attention to the risks of complex exchange-traded products sold to individual investors. Short-volatility strategies did not disappear; they reappeared in other forms, which is why later volatility spikes, such as in March 2020 and August 2024, when the VIX briefly reached about 65, were again amplified by positioning.
Lessons
Steady small gains can hide large tail risks; leveraged and inverse products can lose almost everything in a day; low volatility can breed the conditions for a spike. See what the VIX is, mistakes traders make when reading the VIX and what moves stock market indices.
Timeline at a glance
| Date | VIX | Event |
|---|---|---|
| 2017 | Often near 9–11 | Calm; inflows to short-volatility products |
| Late January 2018 | About 11 to 17 | Shares begin to fall |
| February 5, 2018 | Close of 38.80 | Record 20-point jump; XIV collapses after the close |
| February 6, 2018 | Touches 50 | Products shut down |
| January 26–February 9 | — | S&P 500 falls more than 10% |
Lessons for CFD traders
Selling volatility, directly or through strategies that profit from calm markets, earns small, regular gains with the risk of a sudden, very large loss. CFDs on VIX futures or on inverse products carry the same risk, often with gaps far beyond stops. Even traders who never touch volatility products are affected, because the unwinding of these positions can accelerate falls in stock indices. Sizing index positions with the possibility of a volatility shock in mind is part of managing that risk. See what the VIX is.
The calm before
In 2017, the VIX spent long stretches near record lows, around 9 to 11, as US shares rose steadily with few setbacks. Selling volatility, through options or exchange-traded products, delivered steady gains month after month, and inflows into short-volatility products grew. The calm encouraged investors to treat these returns as reliable income rather than as payment for taking a large hidden risk.
Why short volatility was popular
Implied volatility is usually higher than the volatility that actually occurs, so selling it tends to earn a premium over time. In calm markets, futures on the VIX also tend to decline as they approach expiry, adding to the returns of short positions. These features made short-volatility strategies look like a reliable source of income, as long as no sudden spike arrived.
The morning after
On February 6, 2018, investors woke to find that XIV and similar products had lost almost all their value after the previous day’s close. The VIX touched 50 early that day before falling back. Shares were volatile for days, and the S&P 500’s fall from its January high exceeded 10% by February 9, its worst loss since 2011.
Warning signs
Very low volatility, rising assets in short-volatility products and studies warning of a feedback loop were all visible before the event. Few acted on them, because the strategy had worked for so long. The episode showed how the success of a crowded trade can increase the size of its eventual collapse.
Common misreadings
- Treating steady returns as evidence of low risk.
- Assuming exchange-traded products are always simple.
Lessons for product design
XIV and similar products did what their documents said: they delivered the inverse of daily moves in VIX futures, and their terms allowed closure after a large loss. The problem was that many buyers did not appreciate how quickly a single day could wipe them out, or how their own size could amplify the move. The episode prompted closer scrutiny of complex exchange-traded products and how they are explained to individual investors.
How traders could have protected themselves
Traders who sold volatility could have limited position size so that a doubling of volatility would not wipe out their account, bought protective options to cap the loss or avoided products whose structure made an almost total loss possible in a day. Diversifying across strategies that do not all depend on calm markets also helps. The common thread is planning for the rare day rather than the typical one.
Volatility after February 2018
The VIX fell back within weeks, but volatility returned later in 2018, with a sharp sell-off in the final quarter of the year. The calm of 2017 proved to be the exception rather than the new normal.
Volatility and index CFDs
Even traders with no volatility products felt Volmageddon through index CFDs. The S&P 500’s rapid fall, wider spreads and sharp intraday swings tested stops and margin. Positions sized during the calm of 2017, when daily moves were small, were suddenly much riskier, because the same position size now carried far larger daily swings. Adjusting size as volatility changes, rather than keeping it fixed, is one of the clearest lessons of the episode for index traders. A volatility-adjusted size keeps the typical daily swing steady across changing markets.
Frequently asked questions
Why was it called Volmageddon?
Because the collapse of short-volatility products was so sudden and complete, combining “volatility” and “Armageddon.”
Could it happen again?
The specific products involved were closed, but crowded bets on calm markets can build again and unwind just as quickly.
This article is educational content and does not constitute financial, investment, legal or tax advice. Digital assets are volatile and you may lose the amount you invest.
Sources
- The day the VIX doubled: tales of Volmageddon (record 20-point jump; XIV collapse; S&P 500’s worst loss since 2011) — Bloomberg, February 2019
- Volmageddon recollections (VIX from 11.08 to 17.31 the prior week; 38.80 close and 50 the next morning; S&P 500 −10% from January 26 to February 9) — IBKR Campus
- Volatility gauge tops 50 for the first time since Volmageddon (feedback loop between ETPs and volatility; peak the next session) — Bloomberg via BNN
- Yen carry trade unwind: 2024 episode (VIX briefly 65 on August 5) — Lambda Finance, 2026