
What Is the S&P 500?
The S&P 500 tracks about 500 large US companies by market value, covering about 80% of the market. How it works, how concentrated it is and what moves it.
The S&P 500 is the main US stock benchmark, tracking about 500 large companies weighted by market value and covering about 80% of the US market. Because it is market-cap weighted, the largest companies dominate: the 10 largest reached a record 40.7% of the index at the end of 2025.
How it works
- Market-cap weighted: each company’s weight reflects its market value, adjusted for shares available to trade.
- Committee-selected: members must meet size, liquidity and profitability rules.
- Launched in its current form in 1957.
Membership rules
A committee at S&P Dow Jones Indices chooses members using published rules. Companies must be US-based, meet minimum size and liquidity thresholds, have enough shares freely available to trade and show positive combined earnings over the most recent four quarters, as well as in the latest quarter. The committee also aims to keep sector balance roughly in line with the US market. Because of the profitability rule, some large companies wait years before joining. See how index rebalancing works.
What it contains
All major sectors, but technology now dominates: information technology is close to 40% of the index, and the “Magnificent Seven” alone were about 34% at the end of 2025.
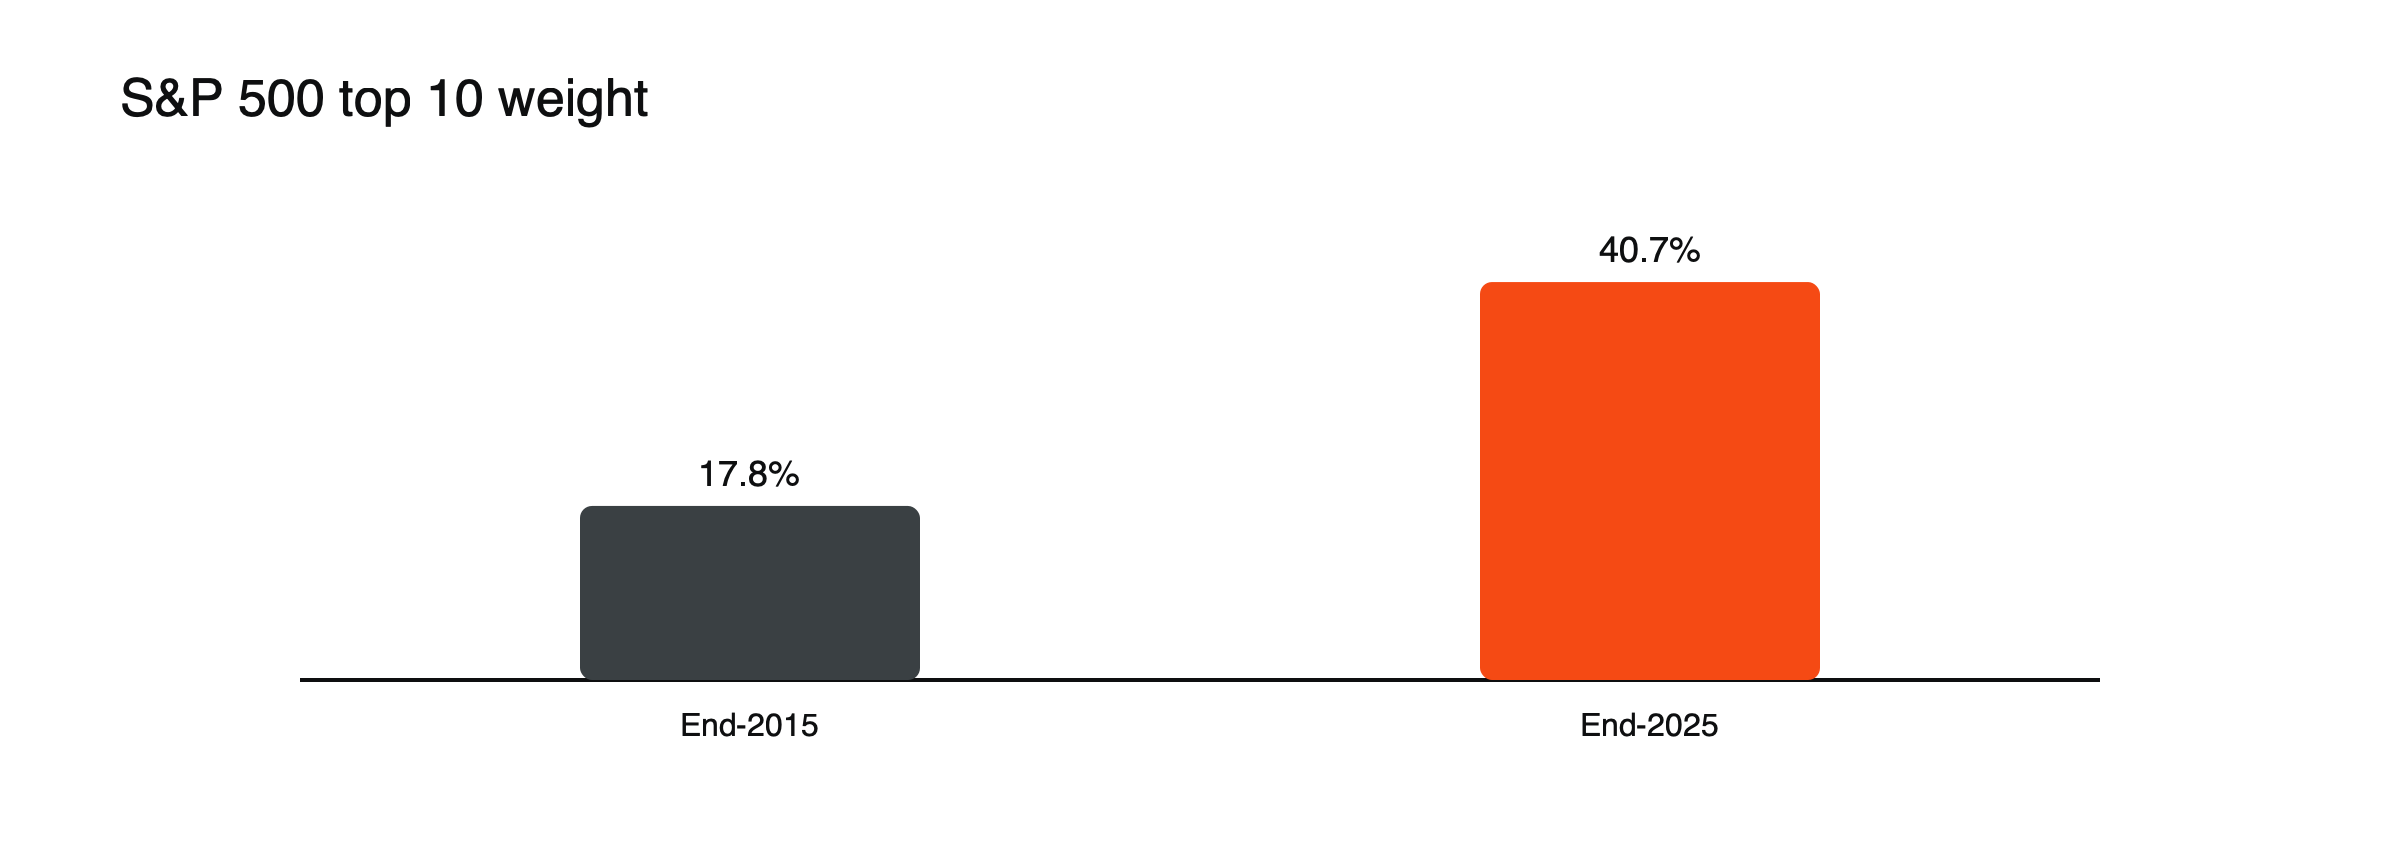
Figure: The S&P 500’s top 10 weight. Source: Walnut, citing Pensions & Investments.
Concentration over time
In 2015, the ten largest companies made up about 17.8% of the index; by the end of 2025, they reached a record 40.7%. That shift means the S&P 500 behaves more like a bet on a handful of technology giants than it once did, and their results can move the whole index. An equal-weighted version of the S&P 500, which gives each member the same weight, shows how the typical company is doing, and its performance can differ sharply from the main index in years when the largest companies lead or lag. See why a handful of stocks can drive an entire index.
What moves it
Earnings of its largest members, interest rates, the economy and sentiment. Because of concentration, results from a handful of tech giants can move the whole index. See what moves stock market indices.
How it is traded
Through index funds and ETFs, futures and options, and CFDs, often called “US 500.” See how stock index CFDs work.
Recent history
The S&P 500 rose about 16.4% in 2025, closing the year at 6,845.5, or about 17.9% including dividends. The path was far from smooth: during the April tariff sell-off it fell about 12% in four days, and its deepest fall from the year’s high reached about 19%. From its low on April 8, it then rallied about 37% by the end of the year.
See S&P 500 vs Nasdaq 100 and what the Dow Jones Industrial Average is.
Trading a US 500 CFD, worked through
With the index at 6,845.5, a trader buys a US 500 CFD at $2 per point, a position worth about $13,691. At the 20:1 retail limit for major indices, margin is about $685. A 100-point rise, about 1.5%, gains $200; a 100-point fall loses the same. A fall like the 19% drawdown of 2025 would have cost about $2,600 at that size, almost four times the margin, which is why sizing from risk rather than from margin matters. (Illustrative trade.) See how to calculate the value of a point on an index CFD.
Futures and trading hours
S&P 500 futures trade almost around the clock on weekdays, and many CFD providers quote the US 500 nearly 24 hours by pricing from futures outside the cash session, which runs from 9:30 a.m. to 4:00 p.m. New York time. The largest moves often come at the cash open, after major US data at 8:30 a.m. and around central bank announcements.
Dividends
Most S&P 500 members pay dividends, so the index falls slightly when they go ex-dividend, and cash US 500 CFDs receive dividend adjustments. Because US companies usually pay quarterly, the adjustments are spread through the year rather than concentrated in one season. See how index dividends are adjusted.
How the index is calculated
The S&P 500 adds up the market value of its members, counting only shares freely available to trade, and divides by a divisor that S&P adjusts for share issues, buybacks and member changes so that the index level is not distorted. A 1% move in a company making up 7% of the index moves the index about 0.07%; the same move in a company making up 0.1% barely registers.
Sector weights
Information technology is by far the largest sector, close to 40% of the index, followed by sectors such as financials, healthcare, communication services and consumer discretionary. Energy, utilities, materials and real estate each make up only a few percent. Because of that mix, the S&P 500 is much more sensitive to technology earnings and interest rates than to oil prices, unlike some other countries’ indices.
The benchmark role
The S&P 500 is the standard benchmark against which US fund managers are judged, and trillions of dollars are invested in funds that track it. That makes membership changes and quarterly rebalancing significant events for the shares involved.
Common misreadings
- Treating the index as an average of 500 equal companies.
- Assuming broad diversification despite heavy concentration.
- Confusing price returns with total returns including dividends.
A typical year includes setbacks
Even strong years for the S&P 500 usually contain sharp falls. In 2025, the index fell about 19% from its high before finishing the year up about 16%. Declines of 10% or more within a year are common, and they often come suddenly, around policy shocks, rate surprises or earnings disappointments. Expecting setbacks, and sizing positions so they can be survived, is part of trading the index rather than a sign that something has gone wrong.
Using the S&P 500 to hedge
Investors with portfolios of US shares sometimes short US 500 CFDs to reduce market exposure temporarily, for example ahead of a major event. A portfolio with a beta of 1.1 needs a short of about 1.1 times its value to offset market moves. The hedge leaves company-specific risk in place and costs financing and spreads, so it suits short periods rather than permanent protection. See how stock beta is calculated.
Price return and total return
The headline S&P 500 is a price index: it does not include dividends. In 2025, its price return was about 16.4%, while its total return, assuming dividends were reinvested, was about 17.9%. Over long periods, reinvested dividends account for a meaningful share of the index’s returns, which matters when comparing it with other investments or with total return indices such as the DAX. Cash US 500 CFDs reflect this through dividend adjustments, which credit long positions and debit shorts as members go ex-dividend through the year.
Frequently asked questions
Is the S&P 500 the same as the US stock market?
It covers about 80% of the value of the US market, so it is widely used as a proxy, but it excludes smaller companies, which are tracked by indices such as the Russell 2000.
Why do people say the S&P 500 is less diversified than it used to be?
Because a small number of very large technology companies now make up a much bigger share of the index than a decade ago.
This article is educational content and does not constitute financial, investment, legal or tax advice. Digital assets are volatile and you may lose the amount you invest.
Sources
- Key learnings: US market indices (S&P 500 tracks 503 large companies, about 80% of the US market; Dow 30 price-weighted; Nasdaq-100 largest non-financials, about 60% tech; Russell 2000 small caps; top 10 at 40.7%) — Vested Finance, 2026
- Stock market concentration statistics (top 10 a record 40.7% at end-2025; Magnificent Seven 34.3%; 17.8% in 2015) — Walnut, 2026
- What past sector concentrations tell us about today’s tech-heavy S&P 500 (IT near 40%; S&P 500–Nasdaq-100 correlation 0.98 in March 2026) — CME Group, 2026
- Share index SMI (launch years: Dow 1896, S&P 500 1957, Hang Seng 1969; price- vs cap-weighted examples) — SIX Group
- US stocks vs ASX shares in 2025 (S&P 500 +16.39% price, 17.88% total return, closed at 6,845.5; Nasdaq Composite +20.36%) — The Motley Fool Australia, January 2026
- 2025 index returns and drawdowns (S&P 500 16%, max drawdown −19%, +37% since April 8 low; Russell 2000 11%, −24%, +41%) — Charles Schwab, December 2025
- How the stock market made back its losses after the trade war escalated (S&P 500 −12% in four days, April 2025) — AP via Fortune