
Mistakes Traders Make Around Earnings Season
Earnings season mistakes mapped as a decision tree: full size into reports, trading headlines, chasing first moves, ignoring peers and stacking leverage.
The most common earnings season mistakes are holding full-size positions through reports, reacting to headline numbers without reading guidance, assuming stops will protect against gaps, chasing the first move after the release, ignoring peers’ results and forgetting that leverage magnifies a gap. Each sits at a decision point with a costly branch and a safer one.
How the decision tree works
An earnings report forces a sequence of decisions: before the release, at the release, in the minutes after it and over the following days. At each point, traders choose a branch, often without noticing. This article walks through the tree in order. At every decision point it describes the trap branch, where most avoidable losses come from, and the safer branch. The examples use a hypothetical position so the costs can be compared.
The position
A trader holds a long position of 200 CFD shares in a company trading at $100, an exposure of $20,000, with $4,000 of margin at the 5:1 retail limit and a stop at $95, risking about $1,000 in normal conditions. The company reports after the close tomorrow. (Illustrative figures.)
Decision point 1: hold through the report?
The trap branch: keep the full position, assuming the stop limits the risk to $1,000. Results disappoint, and the shares open at $82. The stop fills at the opening price, so the loss is about $3,600, 90% of the margin and more than three times the planned risk.
The safer branch: decide in advance how large a gap you could accept, then size for it. Cutting the position to 50 shares before the report would have limited the same gap to about $900. Options markets often imply the size of the expected move, which is a useful guide for this decision. Some traders close entirely and re-enter after the report.
The mistake this avoids: holding full size through reports and trusting stops in a gap. See how stop-loss orders work and why they can slip.
Decision point 2: what to look at when the numbers arrive?
The trap branch: read the headline, an EPS beat or miss, and act on it immediately.
The safer branch: read revenue against expectations, margins, key business metrics and, above all, guidance before deciding anything. When Netflix reported in April 2022, the headline was a loss of about 200,000 subscribers against expectations of growth, but its forecast of a further loss of about 2 million subscribers in the following quarter mattered just as much; the shares fell 35% the next day. See how to read an earnings report.
The mistake this avoids: trading the headline and ignoring guidance. See what company guidance is.
Decision point 3: act on the first move?
The trap branch: buy or sell in the first minutes of after-hours trading, when liquidity is thin, spreads are wide and the price reflects headlines rather than details. First moves often reverse once the earnings call begins and analysts publish their reactions.
The safer branch: wait for the earnings call and, for most traders, the next regular session, when prices reflect a fuller reading of the results and spreads have normalized. Missing part of a move is usually cheaper than entering at the worst point of a reversal.
The mistake this avoids: chasing the first move.
Decision point 4: what about the rest of the sector?
The trap branch: treat each company’s report in isolation. A trader long two retailers watches only the one reporting today, while the other falls 6% in sympathy.
The safer branch: check which peers report during the season and how your holdings react to their results. On the day Meta fell 26% in February 2022, Snap and Pinterest jumped on their own results, while other technology shares slid with Meta. Read-across from peers can move a share as much as its own news.
The mistake this avoids: ignoring peers.
Decision point 5: how much leverage across the season?
The trap branch: hold several leveraged positions through a busy reporting week, each sized as if no report were due.
The safer branch: add up exposure to companies reporting in the same week and keep the total small enough that two or three bad gaps would not threaten the account. At 5:1 leverage, a 20% gap wipes out a position’s margin; several in one week can do serious damage. See how to calculate your exposure on a stock CFD.
The mistake this avoids: forgetting that leverage magnifies a gap.
The tree in one table
| Decision point | Trap branch | Safer branch |
|---|---|---|
| Before the report | Full size, trusting the stop | Size for the gap you can accept |
| At the release | Act on the headline | Read revenue, margins and guidance |
| Minutes after | Chase the first move | Wait for the call and the next session |
| Across the sector | Ignore peers | Track peer reports and read-across |
| Across the season | Full leverage on many reporters | Cap total exposure to reporting companies |
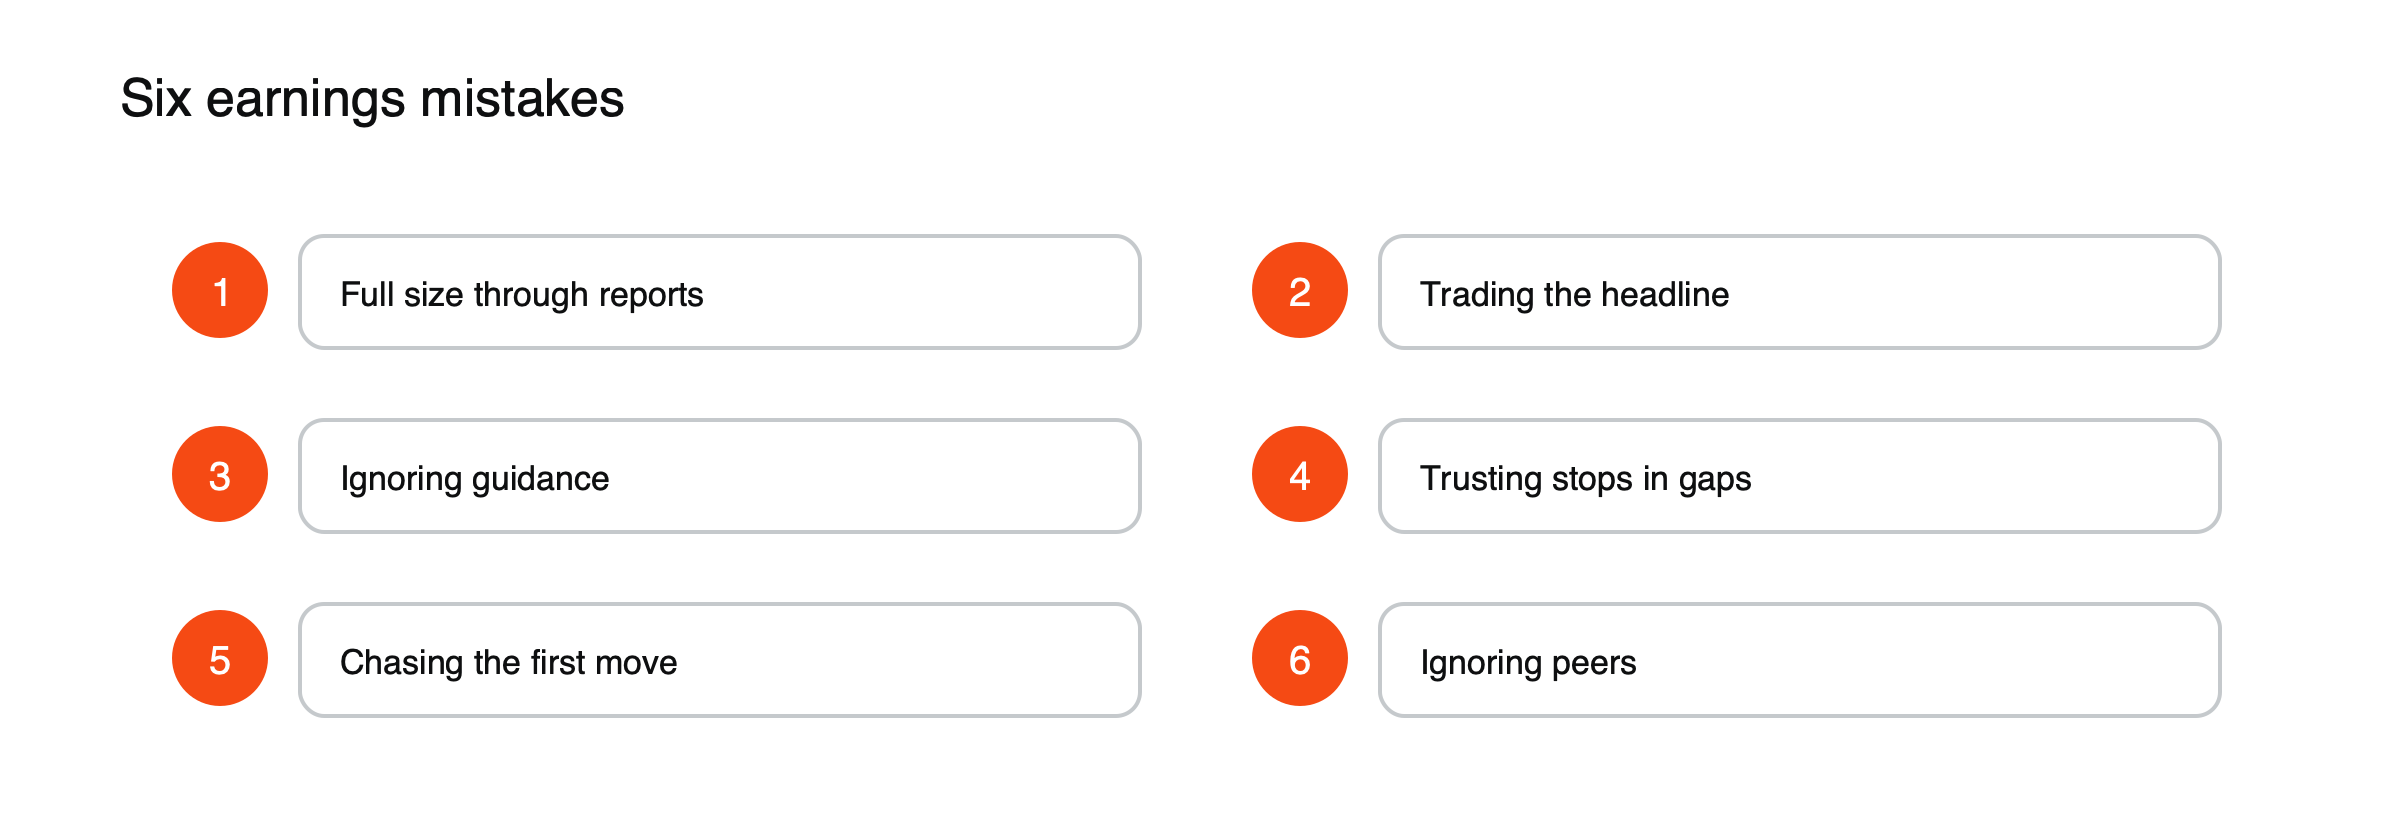
Figure: Six earnings season mistakes.
Mapping your own tree
Before each earnings season, list the companies you hold or plan to trade and their report dates, then write your branch choice for each decision point: how much to hold through, what to read first, how long to wait and how much total exposure to allow. Deciding these in a calm week is far easier than deciding them at 10 p.m. with the shares moving 15% after hours. See how earnings reports move share prices and how stock CFDs work.
Decision point 6: after the first day
The trap branch: assume the first day’s move tells the whole story, either holding a losing position in the hope it will bounce or closing a winning one too early.
The safer branch: reassess the original reason for the trade in light of the results. If guidance or key metrics undermined the idea, close the position regardless of the price. If they strengthened it, consider whether the share may keep drifting as analysts raise forecasts. Research has found that shares often continue moving in the direction of large earnings surprises for some weeks.
The mistake this avoids: reacting to the price instead of the information.
When holding through can make sense
Holding through a report is not always wrong. A long-term investor with an unleveraged position and a clear view of the business may accept the gap risk. A trader with a small position sized for a large gap may decide the potential reward justifies it. The decision tree is not meant to forbid holding through, but to make sure the choice is deliberate and sized for the worst plausible outcome.
Habits for every season
Keep an earnings calendar for every share you hold and its main peers. Note the expected move implied by options where available. Write down your branch choices before each report. After the season, review which decisions helped and which hurt.
The cost of waiting, in numbers
Waiting for the next session has a cost when the first move holds. Suppose the shares jump from $100 to $112 after hours and open the next day at $114. A trader who waited enters 2% higher than one who bought in the first minutes. But on reports where the first move reverses, the early buyer might enter at $112 and see the shares close at $103 the next day, an 8% loss. (Illustrative figures.) Over many reports, a modest cost from waiting is usually smaller than the losses from chasing moves that reverse, especially after thin after-hours trading. Waiting also gives time to read guidance and margins, so the decision rests on information rather than on the speed of the first reaction. For most traders, that trade-off favors patience. Patience is also cheaper in another sense: spreads in after-hours trading are usually wider than in the regular session, so early entries pay more to get in before any price movement is considered.
This article is educational content and does not constitute financial, investment, legal or tax advice. Digital assets are volatile and you may lose the amount you invest.
Sources
- How Meta Platforms made history (−26.4% day-to-day) — Benzinga, February 2022
- Meta share price fall shakes world tech stocks (Snap and Pinterest after-hours moves) — The Financial Express / Reuters
- Netflix shares fall 35% after revealing drop in streaming subscribers ($54 billion of market value; closed at $226.19; forecast loss of another 2 million subscribers) — Bloomberg via The Irish Times, April 2022
- Netflix suffers first loss in worldwide subscribers in its history (200,000 lost vs a forecast gain of 2.5 million) — AP, April 2022