
What Happened on Black Thursday, Bitcoin’s March 2020 Crash?
On March 12–13, 2020, Bitcoin fell roughly 50% in about a day. Here is how leverage, thin order books and a DeFi auction failure turned a sell-off into a crash.
Bitcoin Black Thursday is the name traders gave to March 12, 2020, when Bitcoin fell roughly 50% from its high in about a day, briefly trading in the high $3,000s on some exchanges. A global rush for cash at the start of the COVID-19 crisis hit a market full of leveraged positions, and forced selling did the rest.
The backdrop
In early March 2020, markets everywhere were repricing the pandemic. Stocks were falling fast, and investors were selling almost anything that could be sold to raise cash or cover losses elsewhere. US stock trading was halted by market-wide circuit breakers four times that month, including on March 12 itself. Even gold, the traditional safe haven, gave back nearly 15% over five sessions from its March 9 high as investors scrambled for dollars.
Bitcoin had no special protection from that rush. It was simply another asset that could be sold, and unlike stocks it could be sold around the clock, including when other markets were closed. Inside crypto, a large share of trading ran on borrowed money through derivatives such as perpetual futures. That leverage is what turned a bad day into a historic one.
How the crash unfolded
Two waves. Bitcoin slid through March 12 in two sharp waves, the second running past midnight into March 13. At the worst point it had fallen more than 50% from the day’s high, trading briefly near $3,600 on some venues, before rebounding to around $5,500.
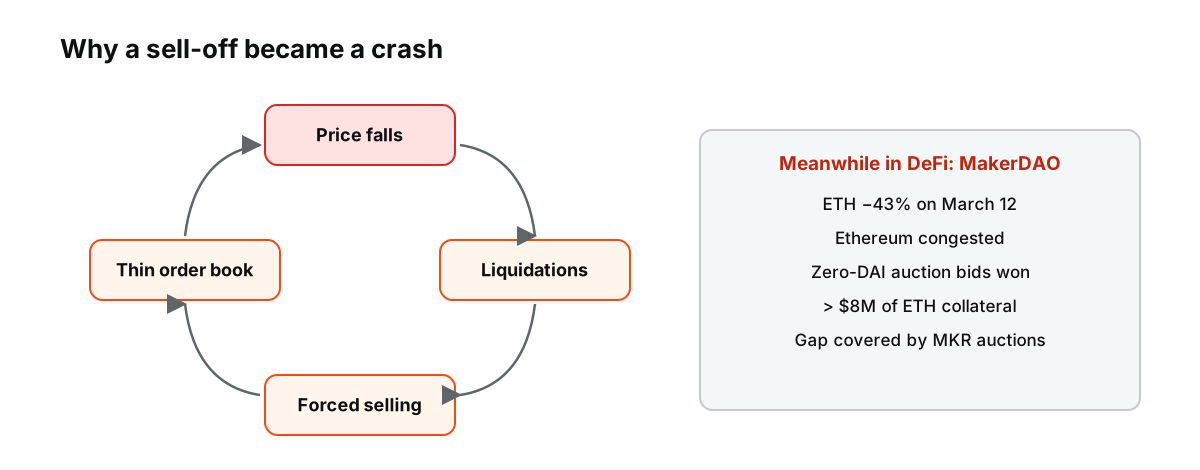
Figure: The liquidation spiral behind Black Thursday, and the parallel failure in MakerDAO’s auctions.
Prices that disagreed. The exact low depends on the exchange, because prices on different venues drifted apart as liquidity vanished. At one point the gap between BitMEX and Coinbase reached almost $800. See why the same coin is priced differently on different exchanges.
The liquidation spiral. As prices fell, leveraged long positions hit their liquidation levels and were closed automatically by selling, which pushed prices down further and triggered more liquidations. On BitMEX, then one of the largest derivatives venues, an analysis by Multicoin Capital estimated about $200 million of positions waiting to be liquidated against only about $20 million of bids on the order book at the critical moment. See how liquidation cascades work.
An outage at the bottom. BitMEX went offline for a short period at the height of the second wave, with very little left on the bid side of its order book. Some traders believe the pause stopped the cascade from going deeper; others criticized it. Either way, it showed how much the market depended on a few venues staying up.
What a liquidation looked like from the inside
Consider a trader who opened a 10x leveraged long position on March 11, with bitcoin near $7,900. With $1,000 of margin, the position controlled $10,000 of bitcoin. At 10x leverage, a fall of roughly 9.5% is enough to wipe out the margin, so the position would be liquidated somewhere around $7,150. (Illustrative figures; exact levels depend on the exchange’s rules and fees.)
On Black Thursday, bitcoin did not fall 9.5%. It fell more than 50%. The trader’s position would have been closed in the first hour of the slide, long before the low, and the exchange’s liquidation engine would have sold that bitcoin into an already falling market. Multiply that by thousands of positions at different leverage levels and the spiral becomes clear: each liquidation added selling pressure that pushed the next group of positions over their limits.
Why the second wave came at night
Crypto markets never close, but liquidity is not constant. The second and deepest leg of the crash ran past midnight into March 13, when many traders and market makers were less active and order books were thinner. In a 24-hour market, the worst moment can arrive when few people are watching, and automated liquidations do not wait for anyone to wake up.
The DeFi side: MakerDAO’s zero-bid auctions
The crash also tested decentralized finance. MakerDAO, the protocol behind the DAI stablecoin, holds ETH as collateral and auctions it off when loans become undercollateralized. ETH fell about 43% on March 12, and the Ethereum network became congested as everyone rushed to transact at once.
With few bidders able to get transactions through, some liquidators won collateral auctions with bids of zero DAI. Analysts estimated that more than $8 million worth of ETH was taken this way, leaving the system several million DAI short. MakerDAO covered the gap by minting and auctioning new MKR tokens, then changed its auction rules so that zero bids could no longer win.
Lessons the DeFi world took away
The Maker episode became a case study for decentralized lending. Protocols that rely on liquidations need those liquidations to work when the network is busiest, which is exactly when transactions are slowest and most expensive. Price feeds, called oracles, can lag in fast markets, and auctions that assume plenty of competing bidders can fail when bidders cannot get transactions through. Borrowers learned that a collateral buffer that looks generous on a calm day can disappear within hours. See what a blockchain oracle is.
Was bitcoin supposed to be a safe haven?
Before March 2020, bitcoin was often described as “digital gold,” an asset that would hold up when traditional markets fell. Black Thursday did not support that idea, at least not in the short run. In a scramble for cash, bitcoin behaved like a risky, highly leveraged asset: it fell alongside stocks, and further. Supporters argued that a liquidity crisis, in which everything is sold, is a poor test of any asset’s long-term role. Both points can be true. What the day showed clearly is that bitcoin’s correlation with stocks can jump exactly when diversification is most needed. See why crypto and tech stocks often trade as the same risk asset.
What Black Thursday taught traders
Leverage drives crashes. The first wave of selling came from outside crypto, but liquidations turned it into a collapse. Position size and margin buffers decide who survives a day like this.
Order book depth disappears when you need it. Quoted prices mean little if there are no buyers near them. See what an order book is and what slippage is.
Networks congest under stress. Ethereum’s fee spike was part of what broke Maker’s auctions. On Bitcoin, heavy demand pushes fees up too; see how to speed up a stuck Bitcoin transaction.
Venue risk is real. Outages, price gaps between exchanges and uneven liquidation engines meant that the same position could survive on one platform and be wiped out on another.
If a crash like this happens again
- Keep leverage low enough that a 50% move does not liquidate you.
- Keep a margin buffer rather than running positions close to their limits.
- Expect stop orders to fill far from their level when order books thin out.
- Avoid depending on a single platform being available at the worst moment.
- Remember that prices can recover after a forced-selling crash, which is little comfort to anyone liquidated at the low.
What came next
The crash marked the low point of that cycle. The S&P 500 bottomed on March 23 after the Federal Reserve announced unlimited asset purchases. Two months later came the May 2020 halving, and bitcoin went on to new highs in 2021. See what happened to Bitcoin after each halving, and for the basics, what Bitcoin is.
This article is educational content and does not constitute financial, investment, legal or tax advice. Digital assets are volatile and you may lose the amount you invest.
Sources
- March 12: The Day Crypto Market Structure Broke (Multicoin Capital analysis, via Unchained) — Unchained
- TowerWatch #10: The Great Sell-off — BlockTower Capital, March 2020
- What Really Happened to MakerDAO? — Glassnode Insights, 2020
- MakerDAO Debt Crisis Post-Mortem Recommends New Safeguards — Cointelegraph, 2020
- Stock market circuit breakers (triggered four times in March 2020) — Schwab
- March 2020 review and outlook (gold gave back nearly 15% over five sessions from its March 9 high) — Nasdaq
- COVID-19 market crash 2020 (S&P 500 bottom March 23 with unlimited QE) — Fin Still