
How to Calculate Dividend Yield and What a High One Can Signal
Dividend yield = annual dividend ÷ share price. A $1.17 dividend on a $39 share yields 3%. Why a very high yield can signal risk and how payout ratio helps.
Dividend yield is the annual dividend per share divided by the share price: dividend yield = annual dividend ÷ price. A company paying $1.17 a year on a $39 share yields 3%. A very high yield can be a warning rather than a bargain: it often means the share price has fallen because investors doubt the dividend can be maintained.
The formula
Dividend yield = annual dividends per share ÷ current share price
Use the dividends paid over the past year (trailing) or the expected next 12 months (forward).
Worked example (ExampleCo)
- Annual dividend: $1.17 per share
- Share price: $39
- Yield = 1.17 ÷ 39 = 3.0%
- Payout ratio = dividend ÷ EPS = 1.17 ÷ 1.95 = 60%
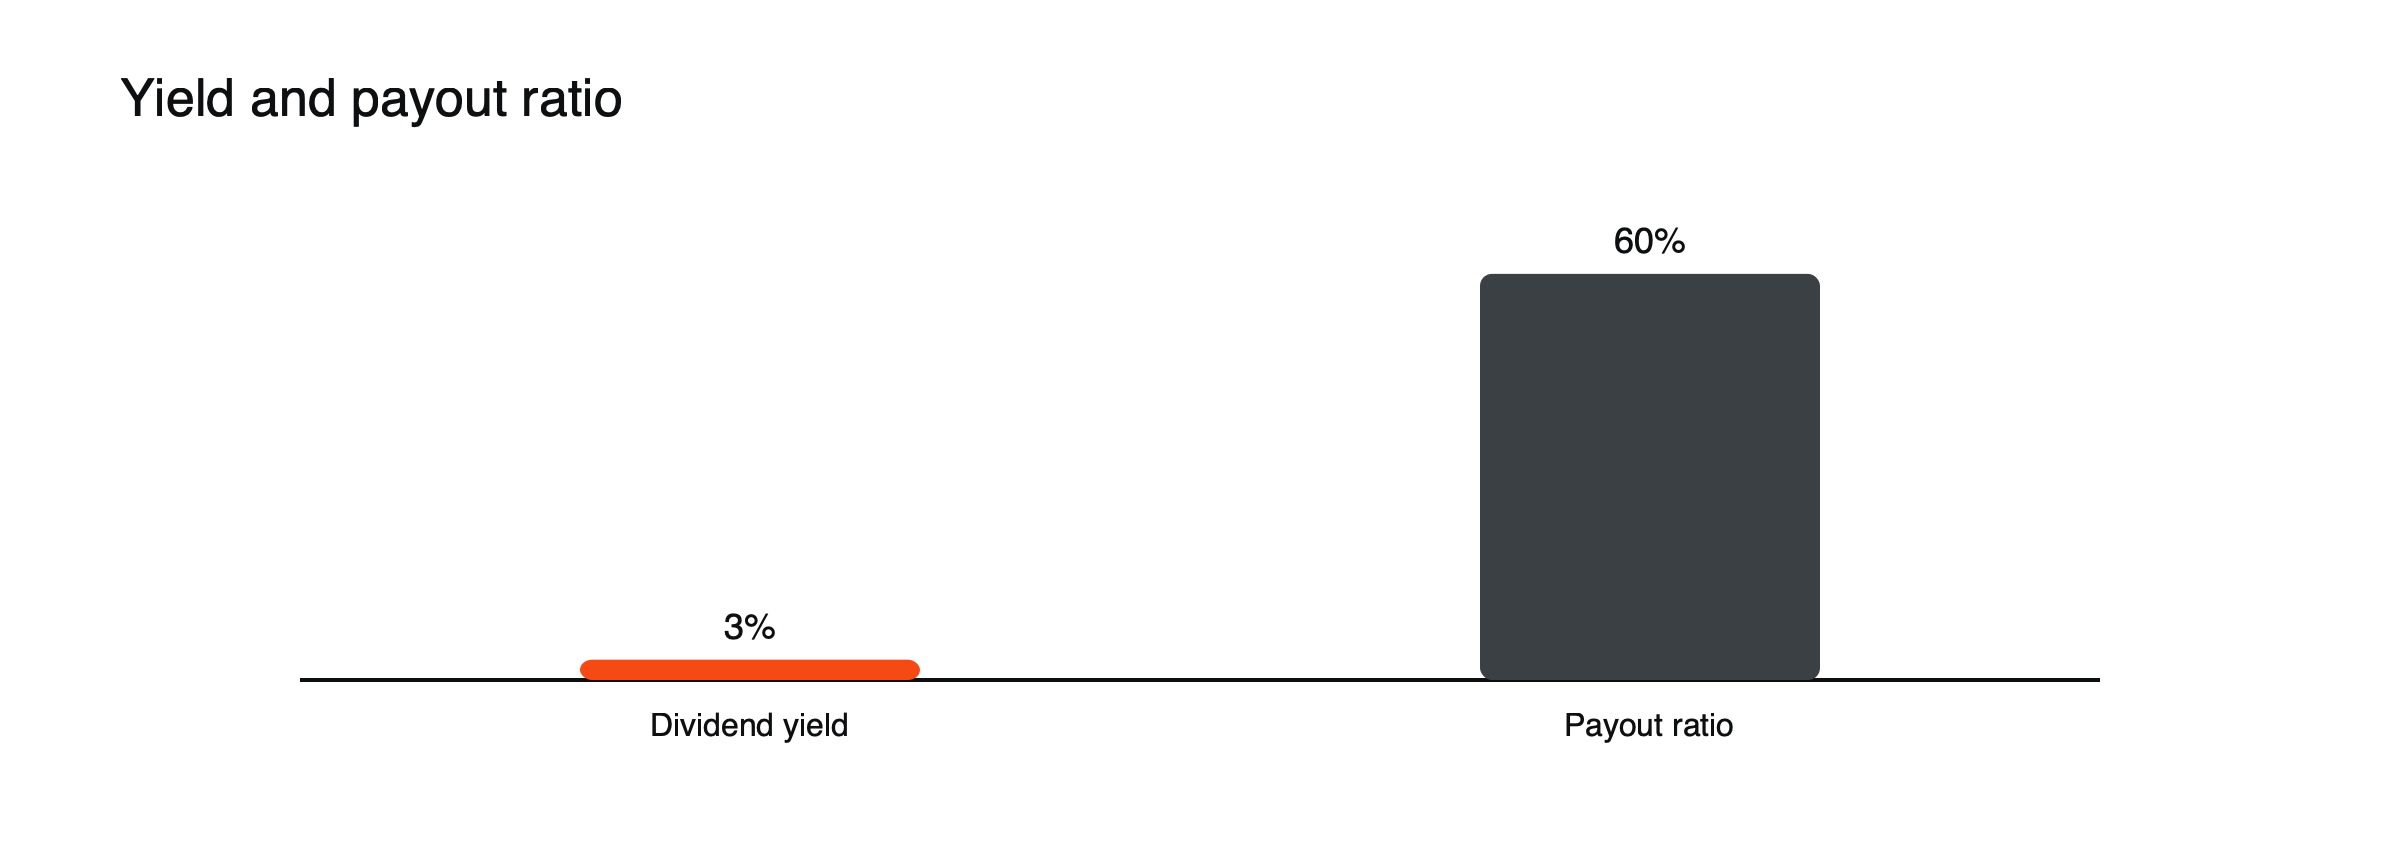
Figure: Yield and payout ratio (hypothetical example).
What a high yield can signal
Yield rises when the price falls. A sudden jump to a much higher yield than peers can mean:
- Earnings or cash flow are under pressure, and a cut may come.
- The payout ratio is above 100%, so dividends exceed profits.
- Debt is rising to fund the dividend.
This is sometimes called a “yield trap.”
A yield trap, worked through
A company pays $1.80 a year and its share has fallen to $20, a yield of 9%. Earnings per share are $1.30, a payout ratio of about 138%, and free cash flow is only $1.10 a share. The dividend costs more than the company earns or generates in cash, so it is being funded from borrowing or savings. If the dividend is cut to $0.80, the yield on the current price falls to 4%, and the share often drops further on the announcement. (Hypothetical figures.)
How to check sustainability
Compare the dividend with earnings (payout ratio) and with free cash flow, and look at the dividend’s history. See how to calculate free cash flow.
Dividend cover
Dividend cover is the inverse of the payout ratio: EPS divided by the dividend. ExampleCo’s cover is 1.95 ÷ 1.17 ≈ 1.7, meaning earnings are 1.7 times the dividend. Cover above about 2 is usually seen as comfortable; below 1 means the dividend exceeds earnings. Checking cover against free cash flow, $2.00 a share for ExampleCo, gives a cash-based view as well. (Hypothetical figures.)
Yield and total return
A dividend is only part of what a shareholder earns. Total return adds the change in the share price. A share yielding 3% that grows its dividend and price by 6% a year can deliver about 9% a year in total, more than a share yielding 7% whose price slowly falls. Focusing on yield alone ignores growth, which over long periods often matters more.
Dividend growth, illustrated
If ExampleCo raises its $1.17 dividend by 6% a year, it reaches about $1.57 after five years. An investor who bought at $39 would then be earning about 4% a year on the original purchase price, even though the quoted yield on the current price may still be around 3% if the share has risen too. (Hypothetical figures.)
CFDs and dividends
CFD holders do not receive dividends directly; long positions get a cash adjustment on the ex-dividend date. See what happens to a stock CFD on ex-dividend day and what moves stock prices.
Yield compared with bonds
Dividend yields are often compared with government bond yields. When bonds yielded very little, as in the 2010s, dividend-paying shares attracted income seekers. When bond yields rose sharply in 2022 and 2023, safe bonds became a strong alternative, and high-yield shares lost some of their appeal. The comparison is imperfect, because dividends can grow or be cut while bond coupons are fixed, but it explains much of how income stocks respond to interest rates. See how interest rates affect stock prices.
Special dividends and buybacks
One-off special dividends can inflate trailing yields, making a share look more generous than its regular payout. Some companies prefer buybacks to dividends, returning cash without committing to a regular payment. Adding buybacks to dividends gives the total shareholder yield, a fuller measure of cash returned. See why companies buy back their own shares.
Common misreadings
- Comparing yields without checking whether special dividends are included.
- Assuming a high yield means a high return.
- Ignoring payout ratio and free cash flow.
Trailing and forward yield, illustrated
ExampleCo paid $1.17 over the past year, a trailing yield of 3.0% at $39. If the company has announced a 5% increase, the expected dividend for the next year is about $1.23, a forward yield of about 3.2%. When a company has signaled a cut, the forward yield can be much lower than the trailing one, which is why checking recent announcements matters. (Hypothetical figures.)
Yields across sectors
Utilities, telecoms, tobacco and some financial and energy companies have traditionally paid high dividends, because they generate steady cash and have fewer growth projects to fund. Fast-growing technology companies often pay little or nothing, reinvesting instead or buying back shares. Comparing a company’s yield with others in its sector is more meaningful than comparing it with the whole market.
Consistent dividend growers
Some companies have raised their dividends every year for decades, through recessions and crises. Such records suggest a durable business and a strong commitment to shareholders, and these companies are popular with income investors. Even so, past increases are not guarantees, and companies with long records have occasionally been forced to cut.
Taxes on dividends
Dividends are often taxed differently from capital gains, and dividends from foreign companies may be subject to withholding tax in the company’s home country. After-tax yields can therefore differ considerably between investors. CFD dividend adjustments may also reflect withholding. Tax rules vary by country and change over time.
A dividend checklist
- Is the yield based on regular dividends or inflated by a special one?
- What are the payout ratio and dividend cover?
- Does free cash flow cover the dividend?
- What is the dividend’s history of increases or cuts?
Dividends in a downturn
Dividends are often cut in recessions, especially by cyclical companies and those with high payout ratios. In severe crises, regulators have sometimes asked banks to suspend dividends to preserve capital. Companies with low payout ratios, strong balance sheets and stable cash flows are usually best placed to maintain payments when conditions worsen, which is why those features matter more than the headline yield.
Reinvesting dividends
Over long periods, reinvesting dividends has accounted for a large share of total stock market returns. An investor who reinvests a 3% yield buys more shares each year, which then pay their own dividends. For CFD traders, who receive cash adjustments rather than shares, that compounding happens only if the cash is used to increase positions.
Dates that matter
To receive a dividend, a shareholder must hold the share before the ex-dividend date. Share prices typically fall by about the dividend on that date, so buying just before it to collect the payment rarely produces a gain. See what happens to a stock CFD on ex-dividend day. The cash adjustment for CFD holders follows exactly the same timing as for shareholders.
Frequently asked questions
Is a higher dividend yield always better?
No. Very high yields often signal that investors expect a dividend cut or see risks in the business.
How often are dividends paid?
It varies: many US companies pay quarterly, while many European companies pay once or twice a year. The yield uses the total annual amount.
Company figures in this article are a hypothetical example (“ExampleCo”) for illustration.
This article is educational content and does not constitute financial, investment, legal or tax advice. Digital assets are volatile and you may lose the amount you invest.