
How to Calculate Profit and Loss on a Forex Trade
Forex P&L = pips gained or lost × pip value × lots, converted to your account currency. Worked examples for a long EUR/USD and a short USD/JPY trade.
Forex profit and loss is the pips gained or lost times the pip value and position size: P&L = pips × pip value per lot × lots, converted to your account currency. A 0.5-lot EUR/USD long that rises 80 pips earns $400 before costs; a 1-lot USD/JPY short that rises 100 pips loses about $662.
The formula
Pips = (exit − entry) ÷ pip size for a long; (entry − exit) ÷ pip size for a short.
P&L = pips × pip value per lot × lots, converted to your account currency if needed.
Worked example 1: long EUR/USD
- Buy 0.5 lots at 1.1000, sell at 1.1080
- Pips = +80; pip value for 0.5 lots = $5
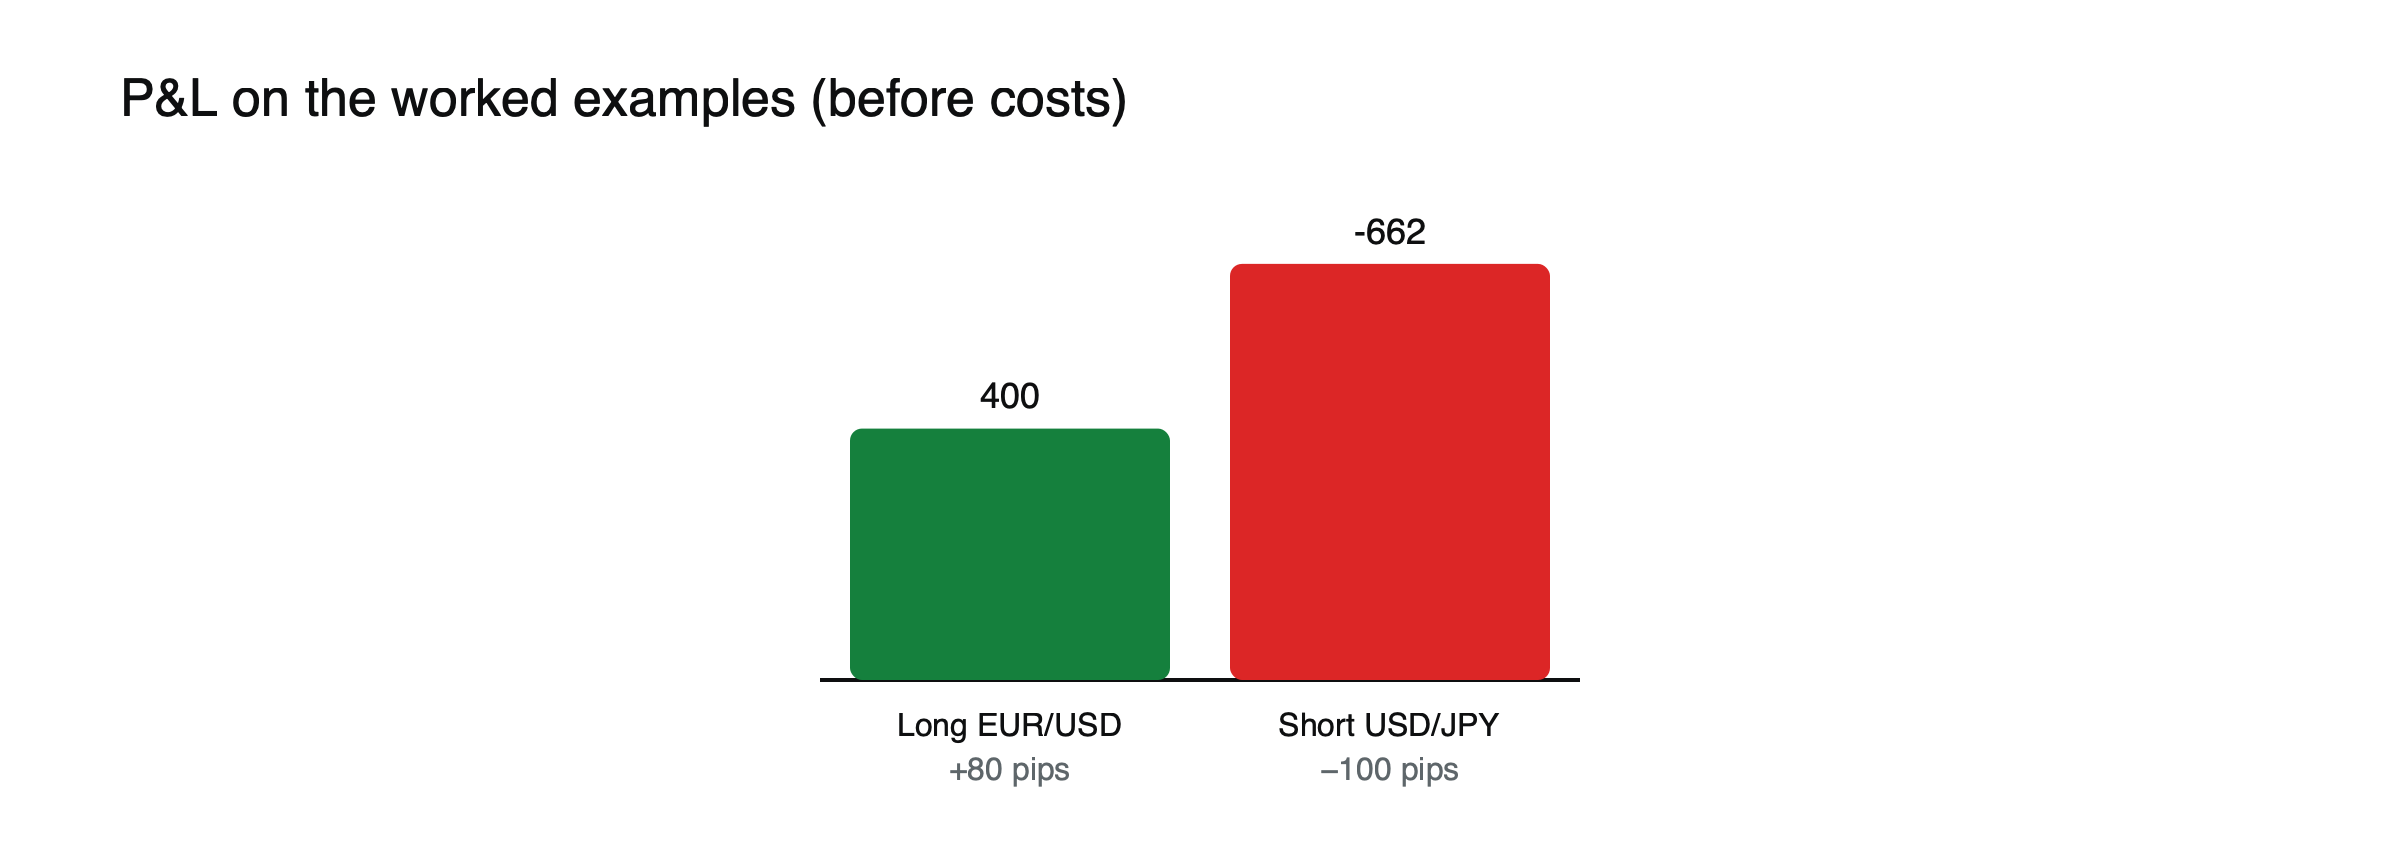
Figure: Profit and loss on the two worked examples, before costs.
P&L = 80 × $5 = +$400 before costs.
Worked example 2: short USD/JPY
- Sell 1 lot at 150.00; price rises to 151.00, and you close
- Pips = −100; pip value = ¥1,000 per pip
P&L = −100 × ¥1,000 = −¥100,000 → at 151, about −$662.
Worked example 3: short EUR/GBP, dollar account
- Sell 1 lot at 0.8600, buy back at 0.8550
- Pips = +50; pip value = £10 per pip
P&L = 50 × £10 = £500, converted at GBP/USD 1.2700 to about +$635.
Worked example 4: long GBP/USD, euro account
- Buy 0.3 lots at 1.2700, close at 1.2600
- Pips = −100; pip value for 0.3 lots = $3
P&L = −100 × $3 = −$300, converted at EUR/USD 1.1000 to about −€272.73.
Subtract costs
Deduct the spread, any commission and overnight rollover. On the EUR/USD example, a 1-pip spread costs $5 and two nights of rollover might add or subtract a few dollars. See how much the spread costs on a forex trade and what forex rollover is.
The first example, net of costs
Back to the 0.5-lot EUR/USD long that gained 80 pips, +$400. A 1-pip spread costs about $5. Suppose the position was held for three nights at a rollover charge of $3.50 per lot per night, about $5.25 for 0.5 lots. (Example costs.) Net result: about $389.75. Costs took about 2.6% of the gross profit here; on a trade aiming for 10 pips, the same spread would take 10%.
Closing in parts
Suppose you close half of the 0.5-lot position at +40 pips and the rest at +80 pips. The first half earns 40 × $2.50 = $100, the second 80 × $2.50 = $200, for $300 in total, less than holding the whole position to +80 but more than closing it all at +40. Calculating each part separately and adding them up gives the right answer whatever the order.
Floating vs realized
While a position is open, P&L is «floating» and changes your equity; it becomes realized when you close. See equity, free margin and margin level explained.
For pip values, see how to calculate pip value and how the forex market works.
P&L as a share of the account
A profit or loss means more when compared with the account. On a $10,000 account, the $389.75 gain above is about 3.9%; on a $2,000 account, about 19.5%. Thinking in percentages shows whether a trade’s outcome is in line with your risk plan, and makes results comparable as the account grows or shrinks.
When conversion happens
For pairs whose quote currency differs from your account currency, platforms convert profit and loss at the current rate while the position is open and fix it when the position closes. A long-held position can therefore show small changes in account-currency P&L even when the pair itself has not moved, because the conversion rate has.
Worked example 5: a yen cross, dollar account
- Buy 0.2 lots of EUR/JPY at 165.00, sell at 166.20
- Pips = +120; pip value for 0.2 lots = ¥200
P&L = 120 × ¥200 = ¥24,000, converted at USD/JPY 150.00 to about +$160. Neither the euro nor the dollar price of the yen at entry matters; only the yen result and the conversion rate at closing do.
Break-even after costs
Before a trade can show a profit, the price must move far enough to cover its costs. On an account charging a 1.2-pip spread with no commission, a EUR/USD trade needs to move 1.2 pips just to break even. On an account with a 0.1-pip spread and a $7 round-trip commission per lot, the commission is worth 0.7 pips per lot, so break-even is about 0.8 pips. Adding expected rollover for the holding period gives the full break-even distance. Knowing it helps judge whether small targets are realistic.
Best and worst points during a trade
The final P&L hides how a trade got there. Recording the largest loss a position showed before it recovered, and the largest gain it showed before it was closed, reveals whether stops are too tight or targets too timid. A trade that closed at +40 pips after being +90 suggests the exit could be improved; one that closed at +40 after being −60 suggests the risk taken was larger than the result implies.
P&L over many trades
Single results say little; patterns across many trades say a lot. Totaling net P&L by week or month, alongside win rate, average win and average loss, shows whether a method actually makes money after costs. A spreadsheet that applies the same formula to every closed trade, including spread, commission and rollover, gives a far more honest picture than the platform’s gross figures alone. See how to calculate profit on a crypto trade after fees for the same approach applied to crypto.
Records for tax
In many countries, trading gains and losses must be reported, often in the local currency and sometimes converted at specific official rates. Keeping each trade’s realized P&L, costs and dates in one place makes those calculations simpler at the end of the year. Local rules vary, so checking with a tax adviser is worthwhile.
A quick P&L checklist
- Count the pips in the right direction for a long or a short.
- Use the pip value for your position size.
- Convert into your account currency at the closing rate.
- Subtract spread, commission and rollover.
- Express the result as a share of the account.
Frequently asked questions
Why does my platform show a slightly different P&L than my calculation?
Usually because of the spread, rollover already charged, commission or the conversion rate used. Including those in your own calculation normally closes the gap.
Is P&L calculated on the bid or the ask?
A long position is valued at the bid, the price at which you could sell; a short position at the ask, the price at which you could buy it back.
Leverage, margin and cost figures in this article are example values for illustration. Actual terms depend on the provider, the instrument and the rules in your country.
This article is educational content and does not constitute financial, investment, legal or tax advice. Digital assets are volatile and you may lose the amount you invest.