
Oil vs Natural Gas: How Their Price Drivers Differ
Oil is global and easily shipped; natural gas is regional, weather-driven and harder to store. Why gas is more volatile and how the two energy markets compare.
Oil vs natural gas differ mainly in how easily they move. Oil ships everywhere, so prices are largely global and track benchmarks such as Brent and WTI. Gas needs pipelines or costly liquefaction, so prices are regional and driven by local weather and storage. Gas is usually far more volatile, as Europe saw in 2022.
Side by side
| Crude oil | Natural gas | |
|---|---|---|
| Market | Global | Regional (US, Europe, Asia) |
| Benchmarks | Brent, WTI | Henry Hub (US), TTF (Europe) |
| Main demand | Transport, petrochemicals | Heating, power, industry |
| Weather sensitivity | Moderate | High |
| Storage | Easier | Harder, seasonal |
| Supply policy | OPEC+ coordination | No equivalent cartel |
| Weekly US report | Wednesday | Thursday |
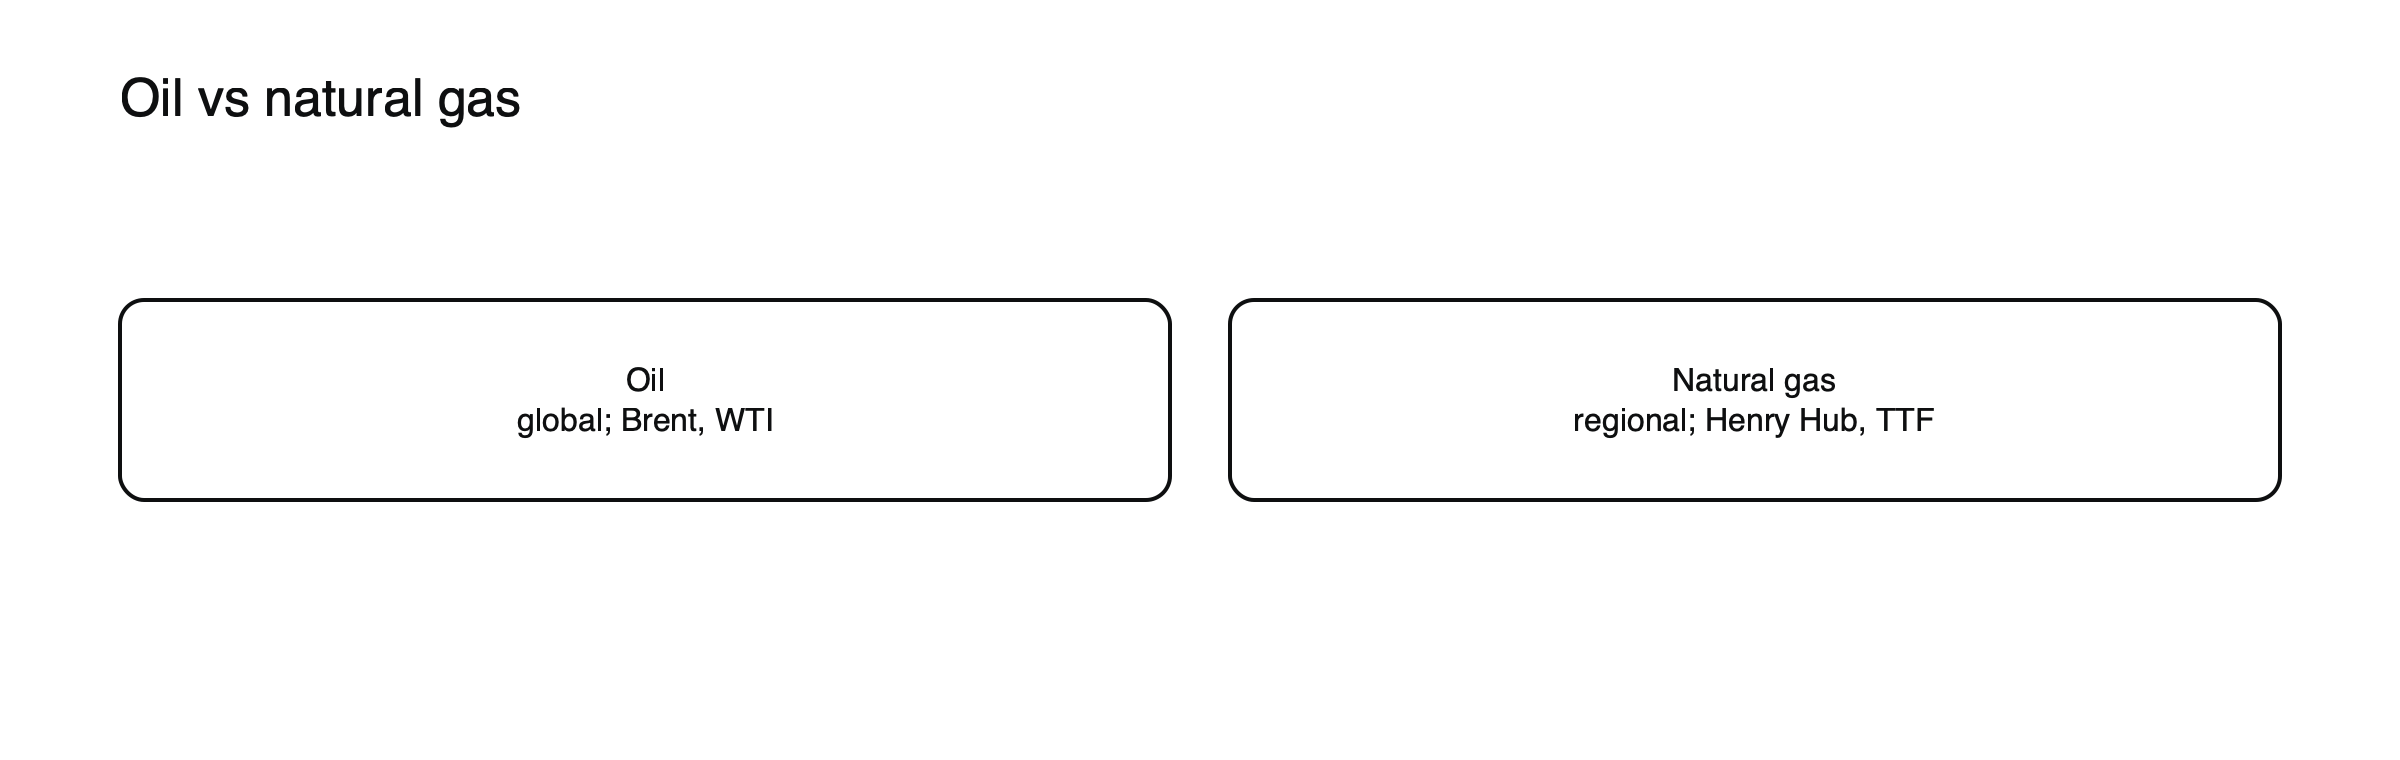
Figure: Global oil, regional gas.
Units and prices
Oil is priced in dollars per barrel. US natural gas is priced in dollars per million British thermal units at the Henry Hub, while European gas at the Dutch TTF hub is priced in euros per megawatt-hour. Because the units differ, comparing prices needs conversion: one barrel of oil contains roughly as much energy as about 5.8 million British thermal units of gas. Many traders compare the two in energy-equivalent terms to judge whether gas is cheap or expensive relative to oil.
Why gas is more volatile
Demand swings with temperature, storage is limited, and moving gas between regions is slow and costly, so small surprises can cause large price jumps.
Where they connect
Much US gas is produced alongside oil, so oil drilling affects gas supply; in some regions, contracts link gas prices to oil; and both react to economic growth.
Liquefied gas links the regions
Gas can cross oceans only after being cooled into liquid form and shipped on specialized tankers, then turned back into gas at the destination. Liquefied natural gas has gradually linked regional markets, so a shortage in Europe or Asia can draw cargoes away from other buyers and lift prices there. But liquefaction capacity is limited and expensive to expand, so regional prices can still diverge widely, especially in a crisis.
Europe’s 2022 crisis
When pipeline supplies from Russia were cut in 2022, European gas prices reached about ten times their normal levels, while US gas, tied to domestic production, rose far less. Oil also climbed, but by much less in percentage terms. The episode showed how regional gas markets can behave very differently from global oil when supply routes are disrupted.
2026 and the Gulf
The 2026 disruption to shipping through the Strait of Hormuz affected both markets, since the Gulf exports both crude oil and large volumes of liquefied gas. Oil prices rose sharply and then fell back as traffic resumed and tankers carrying both crude and gas began to move again. For gas, the impact depended on how much each region relied on Gulf cargoes.
When gas is the calmer market
Gas is not always more volatile everywhere: when storage is full and weather is mild, US gas can trade quietly while oil reacts to geopolitics, as in early 2026.
See what moves crude oil prices, what moves natural gas prices and how commodity CFDs work.
Storage seasons
US gas storage typically builds from spring to autumn and draws down through winter. The weekly storage report, released on Thursdays, is compared with the five-year average for the same week. A winter that is colder than normal, or a summer heat wave that raises power demand, can draw storage faster than expected and push prices up sharply. Oil inventories have seasonal patterns too, but they are less extreme.
Trading them as CFDs
Natural gas CFDs often move several times as much in percentage terms as oil CFDs in a given week, so positions need to be smaller for the same risk. Both usually follow futures contracts that roll monthly, and both trade almost around the clock with daily breaks. Spreads on gas are often wider relative to price. Treating a gas position like an oil position of the same size is a common way to take far more risk than intended. See how to size a CFD position using risk per trade.
Henry Hub and TTF
The two most watched gas benchmarks reflect very different markets. Henry Hub, a pipeline hub in Louisiana, prices gas in the United States, where large domestic production keeps prices relatively low and tied to local weather and storage. TTF, a virtual trading point in the Netherlands, prices gas in Europe, which imports much of its supply by pipeline and as liquefied gas. European prices are usually higher and more sensitive to supply disruptions, as 2022 showed.
Gas and electricity
Natural gas is a major fuel for power generation, so electricity demand affects gas prices. Heat waves that drive air conditioning use, or cold, still winter weeks when wind generation is low, can lift gas demand sharply. Oil plays a much smaller role in power generation in most developed economies, which is one reason gas prices react to the weather in ways oil prices do not.
Competition from other fuels
In power generation, gas competes with coal, nuclear and renewables. When gas becomes expensive, some generators switch to coal where they can, which caps demand for gas; when gas is cheap, it takes market share from coal. Growth in wind and solar capacity also changes how much gas is needed, especially in sunny or windy periods. These substitution effects have no close equivalent in oil, whose main use in transport has fewer short-term alternatives.
Common misreadings
- Expecting gas to follow oil because both are energy.
- Comparing prices without converting units.
- Sizing gas positions like oil positions.
Sizing gas against oil, illustrated
Suppose a provider’s natural gas CFD lot is 1,000 million British thermal units and gas trades at $3.00, so one lot is worth about $3,000. (Illustrative contract and price.) On a day when gas moves 5%, a lot gains or loses about $150. An oil position of 100 barrels at $80, worth $8,000, moving a more typical 2%, changes by about $160. The two positions carry similar daily risk even though the oil position is more than twice as large in value. Sizing by typical moves, rather than by position value, keeps the risk of each trade comparable. Checking the provider’s contract size first matters, because gas lots differ widely between providers.
Gas and the energy transition
Gas is often described as a bridge fuel because it emits less carbon than coal. Policies favoring renewables can reduce gas demand, while industrial demand and exports of liquefied gas can grow. These shifts shape long-term prices more than daily trading.
Frequently asked questions
Do oil and gas prices move together?
Sometimes, especially when both respond to economic growth or to a shared supply shock. But gas depends much more on regional weather and storage, so the two often move independently.
Which is riskier to trade?
Natural gas is usually more volatile, so it carries more risk for the same position size. Sizing each by its own typical moves keeps risk comparable.
This article is educational content and does not constitute financial, investment, legal or tax advice. Digital assets are volatile and you may lose the amount you invest.
Sources
- Europe’s energy crisis (gas reached about ten times normal levels in 2022) — Foreign Policy, August 2022
- What’s new: release schedules (Weekly Petroleum Status Report after 10:30 a.m.; Weekly Natural Gas Storage Report Thursday 10:30 a.m.; Cushing stocks; refinery utilization) — US EIA
- Crude oil and petroleum product prices increased sharply in 1Q26 (after military action in the Middle East on February 28 and the de facto closure of the Strait of Hormuz) — US EIA, April 2026
- OPEC+ decides on additional output increase as transit through the Strait of Hormuz resumes (Brent about $72 on July 3, down from about $120 after the conflict began; +188,000 b/d from August) — FN News, July 2026