
What Is the Nasdaq 100?
The Nasdaq 100 tracks the 100 largest non-financial Nasdaq companies, about 60% tech. How it is built, how concentrated it is and why it moves more.
The Nasdaq 100 tracks the 100 largest non-financial companies listed on the Nasdaq stock exchange. It is heavily weighted toward technology, about 60%, plus consumer and healthcare companies. It uses a modified market-cap weighting that limits how large any single company can become, yet its top 10 stocks still make up about half the index.
How it is built
- Non-financial companies only: banks and insurers are excluded.
- Modified market-cap weighting: caps reduce the weight of the largest names; companies above 4.5% together may not exceed 48%.
- Reviewed regularly, with annual reconstitution.
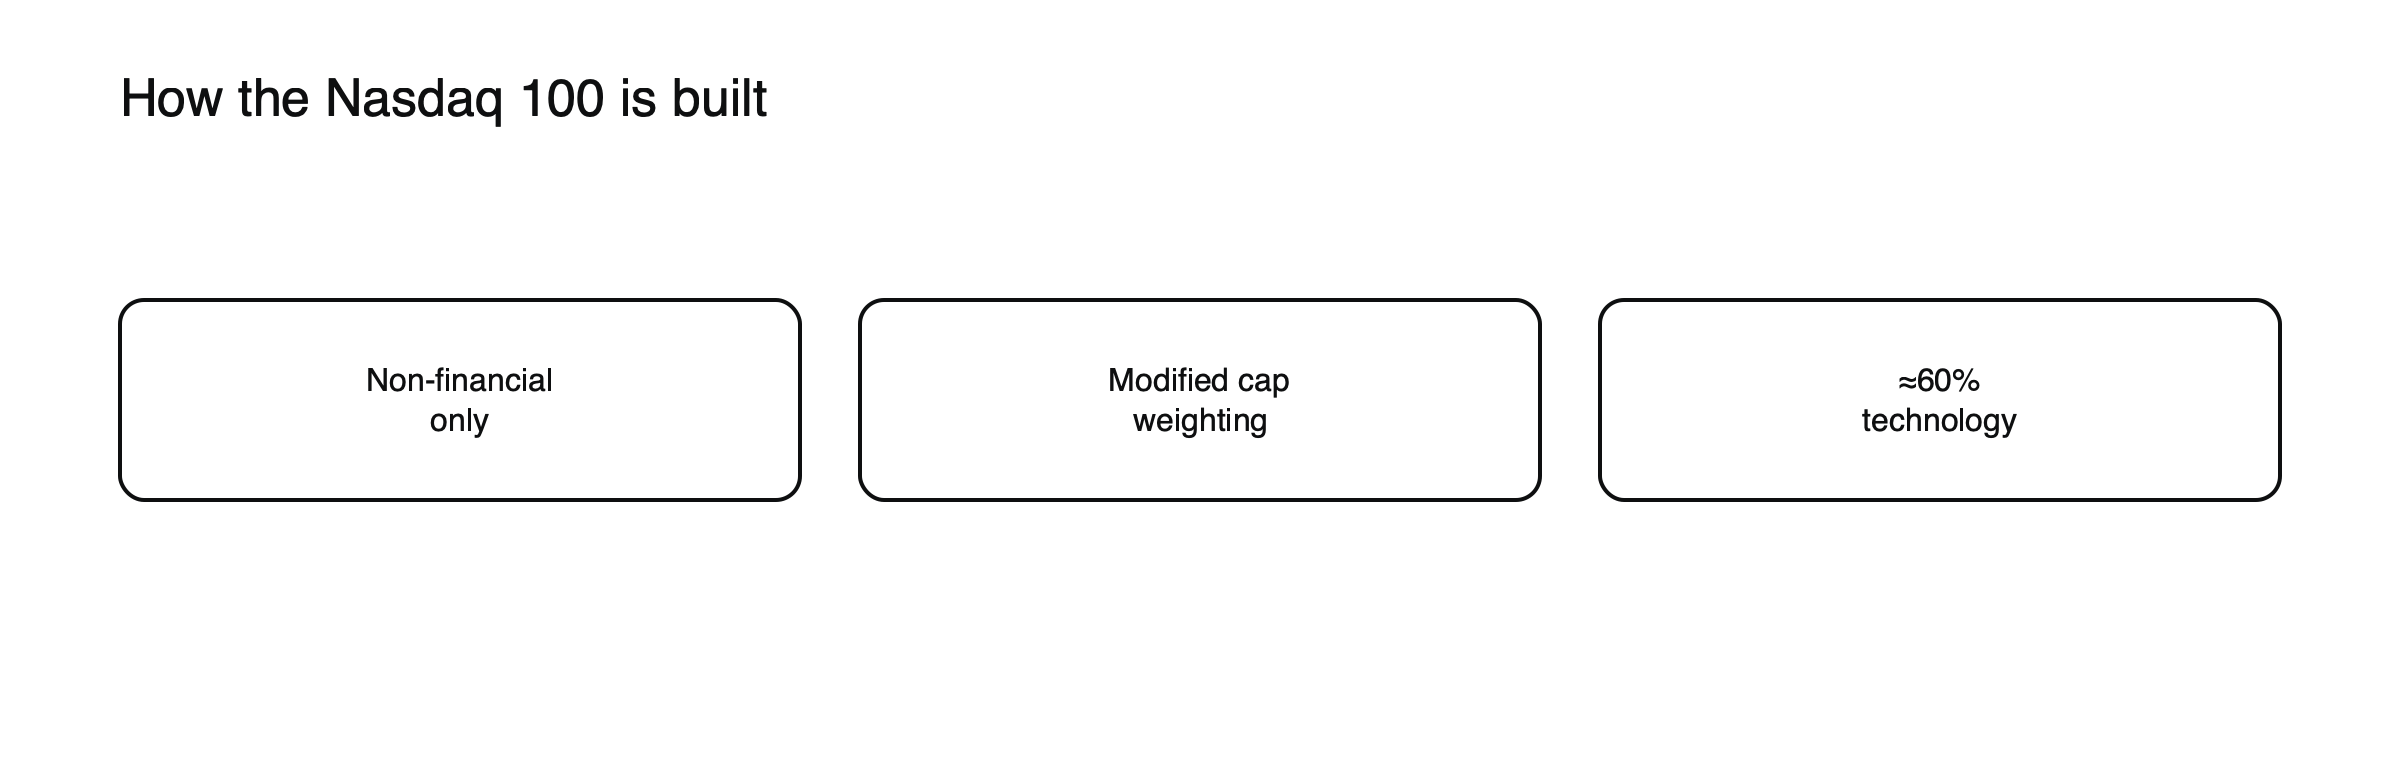
Figure: How the Nasdaq 100 is built.
It differs from the Nasdaq Composite, which includes over 3,000 Nasdaq-listed stocks.
Nasdaq 100 and Nasdaq Composite
| Nasdaq 100 | Nasdaq Composite | |
|---|---|---|
| Members | 100 largest non-financial companies | Over 3,000 Nasdaq-listed companies |
| Financials | Excluded | Included |
| Weighting | Modified market cap | Market cap |
| Use | Futures, funds, CFDs | Mostly as a market gauge |
News reports often quote the Composite; most futures, funds and CFDs track the Nasdaq 100.
Membership and reviews
The Nasdaq 100 is reconstituted once a year, in December, when the largest eligible companies by market value are added and smaller ones removed. Quarterly reviews adjust weights, and a special rebalance can be called if the largest members become too dominant, as happened in July 2023, when the weights of the biggest technology companies were reduced.
Why it moves more than the S&P 500
Its concentration in growth and technology makes it more sensitive to interest rates and tech earnings. See why tech stocks are so sensitive to bond yields.
2025 and the long run
In 2025, the Nasdaq 100 returned about 21.0%, ahead of the S&P 500. The broader Nasdaq Composite was down about 21% at its low on April 8 during the tariff sell-off, then rose about 52% to finish the year. Over a longer period, the Nasdaq 100 beat the S&P 500 in 14 of the 18 calendar years from 2008 to 2025, and its total return since the end of 2007 was about 1,342%, against about 560% for the S&P 500. Past outperformance came with deeper falls, as in 2022, when rising rates hit technology shares hardest.
How closely it tracks the S&P 500
As tech’s weight in the S&P 500 has grown, the two indices have moved almost in lockstep; their 12-month correlation reached 0.98 in March 2026. See S&P 500 vs Nasdaq 100.
How it is traded. Through ETFs, futures and CFDs, often labeled “US Tech 100.” See how stock index CFDs work.
A history lesson
During the dot-com crash, the broader Nasdaq Composite fell about 78% and took 15 years to recover. See what caused the dot-com crash.
Trading a US Tech 100 CFD, worked through
With the index at an illustrative 21,000, a trader buys a US Tech 100 CFD at $1 per point, a position worth $21,000, needing about $1,050 of margin at 20:1. A 250-point move, about 1.2%, gains or loses $250. Because the index often moves 1.5 to 2 times as much as the S&P 500 in percentage terms, many traders use a smaller position for the same risk. (Illustrative trade.) See how to calculate the value of a point on an index CFD.
Rates and the Nasdaq 100, illustrated
Suppose 10-year inflation-protected yields jump 0.15 percentage points on a hot inflation report. (Illustrative scenario.) The S&P 500 falls about 1.5% and the Nasdaq 100 about 2.5%, because more of its value comes from companies whose profits lie further in the future. On days when yields fall sharply, the pattern often reverses. Traders in the Nasdaq 100 therefore watch bond yields almost as closely as company news.
The largest members
A handful of very large technology and communication companies account for a big share of the Nasdaq 100, so their results, product launches and regulatory news move the index noticeably. Even with its weight caps, the top ten members make up roughly half the index. Index traders therefore watch the earnings calendar of these companies as closely as economic data. See why a handful of stocks can drive an entire index.
Why weight caps exist
Funds tracking an index must follow diversification rules that limit how much they hold in any single company. Without caps, the Nasdaq 100’s largest members could grow beyond those limits. The modified weighting keeps the index usable for funds, at the cost of making it slightly less a pure reflection of company size.
A volatile history
The index’s concentration in growth companies has produced both large gains and deep falls. In the dot-com crash, Nasdaq indices lost most of their value; in 2022, as interest rates rose, the Nasdaq 100 fell far more than the S&P 500. Traders should expect larger swings in both directions than in broader indices.
Futures and trading hours
Nasdaq 100 futures trade almost around the clock on weekdays, and US Tech 100 CFDs are usually quoted nearly 24 hours. Liquidity is deepest during the US cash session, from 9:30 a.m. to 4:00 p.m. New York time.
Common misreadings
- Confusing the Nasdaq 100 with the Nasdaq Composite.
- Treating it as a pure technology index.
- Assuming past outperformance will continue.
The artificial intelligence theme
From 2023, enthusiasm about artificial intelligence lifted several of the Nasdaq 100’s largest members, especially chipmakers and cloud computing companies, and drove much of the index’s gains. That made the index even more dependent on one theme and a few companies. Strong results and guidance from those companies have lifted it sharply; any sign that spending on artificial intelligence might slow has produced sharp falls. See why tech stocks are so sensitive to bond yields.
Using it to hedge
Traders with portfolios of technology shares sometimes short Nasdaq 100 CFDs to reduce exposure to the sector as a whole while keeping their views on individual companies. Because the index moves more than broader markets, the hedge needs to be sized with that in mind: a portfolio with a beta of 1.3 to the Nasdaq 100 needs a short of about 1.3 times its value to offset sector moves. The hedge does nothing about company-specific news, and it costs financing and spreads while it is held.
Dividends
Many Nasdaq 100 members pay small dividends or none, preferring to reinvest or buy back shares, so the index’s dividend yield is lower than the S&P 500’s. Dividend adjustments on cash US Tech 100 CFDs are therefore smaller and less frequent. For long positions, that means financing costs are offset less by dividend credits than on broader indices. Traders holding long US Tech 100 positions for weeks should therefore expect a higher net holding cost than on the S&P 500, all else equal, and check the provider’s financing rate before entering.
Frequently asked questions
Why are banks excluded from the Nasdaq 100?
By design, the index includes only non-financial companies, which is one reason it is more concentrated in technology than the S&P 500.
Does the Nasdaq 100 always outperform the S&P 500?
No. It has outperformed in most recent years, but it fell much more in 2022 and in the dot-com crash, when technology shares led the declines.
This article is educational content and does not constitute financial, investment, legal or tax advice. Digital assets are volatile and you may lose the amount you invest.
Sources
- Key learnings: US market indices (S&P 500 tracks 503 large companies, about 80% of the US market; Dow 30 price-weighted; Nasdaq-100 largest non-financials, about 60% tech; Russell 2000 small caps; top 10 at 40.7%) — Vested Finance, 2026
- What past sector concentrations tell us about today’s tech-heavy S&P 500 (IT near 40%; S&P 500–Nasdaq-100 correlation 0.98 in March 2026) — CME Group, 2026
- Your index investments likely aren’t as diversified as you think (Nasdaq 100 modified weighting; top 10 about 53% adjusted; 4.5%/48% rule) — Algorithmic Fire
- When performance matters: Nasdaq-100 vs S&P 500, Q4 2025 (Nasdaq-100 21.0% in 2025; outperformed in 14 of 18 years; +1,342% vs +560% total return since 2007) — Nasdaq via ETF.com
- How the stock market performed in 2025 (S&P 500 +16.4%; Russell 2000 +11.3%; Dow record close 48,731 on December 24; Nasdaq Composite down about 21% at its April 8 low, then +52%) — ValueWalk, January 2026