
What 1970s Inflation Teaches Today’s Markets
In the 1970s US inflation peaked at 14.8%, stocks and bonds lost money in real terms and only a 20% rate broke it. The timeline and the lessons for investors.
1970s inflation shows how hard high inflation is to reverse once expectations take hold. US inflation rose from about 3% in 1972 to a peak of 14.8% in March 1980. Stocks and bonds both lost money after inflation from 1966 to 1979. It took the Fed raising rates to 20% by 1981, and a deep recession, to break it.
Timeline
- Late 1960s: inflation starts rising; the Fed faces political pressure to keep rates low.
- 1972: easy policy before the election; inflation near 3%.
- 1973: the oil embargo quadruples oil prices within months.
- 1975: inflation above 11%.
- August 1979: Paul Volcker becomes Fed chair; inflation above 14%.
- March 1980: inflation peaks at 14.8%.
- June 1981: the federal funds rate reaches 20%; recession follows.
- 1983: inflation falls below 3%.
How it started
Inflation began rising in the late 1960s as government spending on the Vietnam War and social programs added to demand while the Fed kept policy relatively easy. On August 15, 1971, President Nixon ended the dollar’s convertibility into gold at $35 an ounce, breaking the link that had anchored the international monetary system since the 1940s, and imposed temporary wage and price controls. The controls held inflation down briefly, but when they were lifted, prices surged again. Ahead of the 1972 election, the Fed kept policy easy under political pressure, setting the stage for what followed. See why central bank independence matters to markets.
Two oil shocks
The 1973 oil embargo quadrupled oil prices within months, pushing inflation above 11% by 1975 and causing a deep recession. After a partial easing, the Iranian revolution of 1979 disrupted supply again and roughly doubled oil prices, adding to inflation that had never fully come down. Each shock lifted inflation expectations further, making the next round harder to contain. See how energy shocks travel through inflation, rates and currencies.
What it did to markets
From 1966 to 1979, the S&P 500 lost more than 18% in real terms, and 10-year Treasuries lost about 33% after inflation. Commodities and precious metals did much better. See commodities vs stocks during inflationary periods.
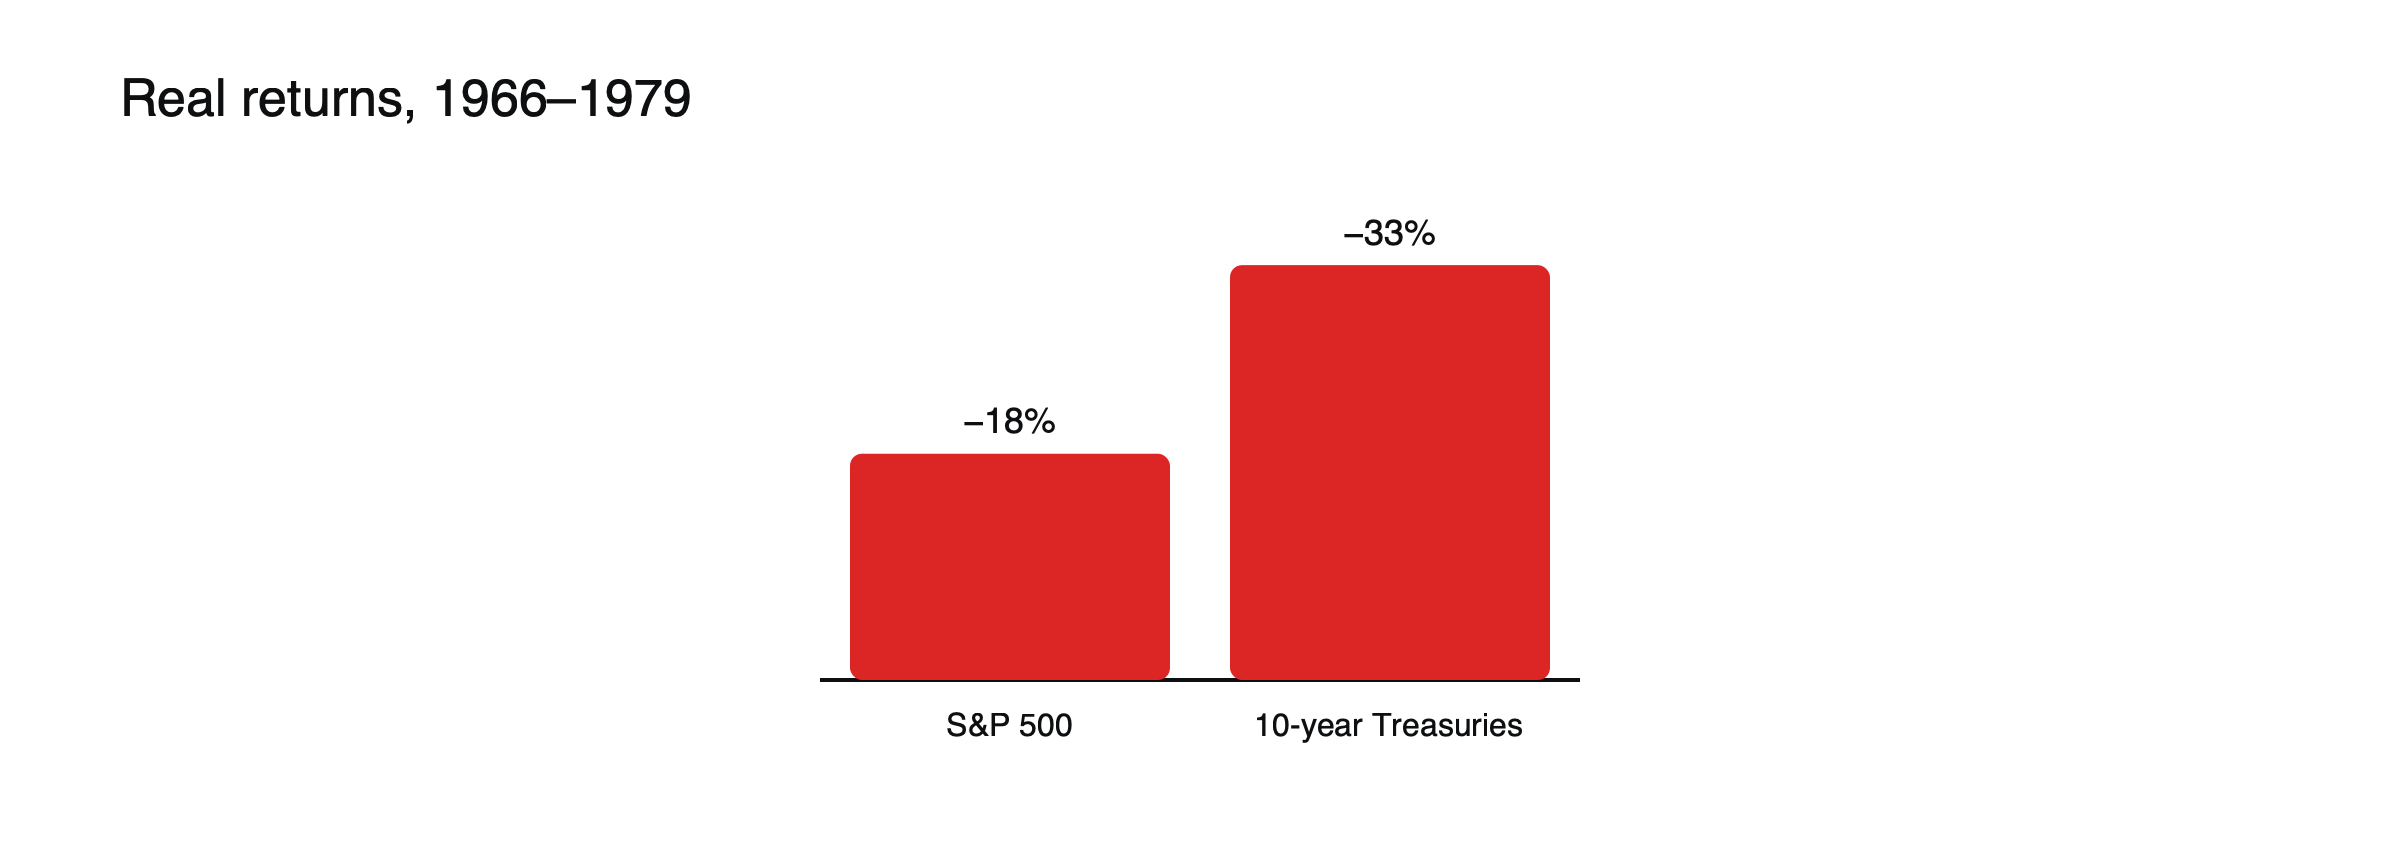
Figure: Real losses for stocks and bonds, 1966–1979. Source: A Wealth of Common Sense.
Gold’s decade
Freed from its fixed price, gold rose from $35 an ounce in 1971 to a peak of $850 on January 21, 1980, as investors sought protection from inflation and a weakening dollar. That nominal record stood for nearly 28 years. The spike came near the very end of the inflation, and gold then fell for two decades as Volcker’s policies restored confidence in the dollar, a reminder that inflation hedges can reverse sharply once inflation is tamed.
A portfolio in the 1970s, illustrated
Suppose an investor held $10,000 split evenly between US shares and 10-year Treasuries from 1966 to 1979, while inflation averaged roughly 6% to 7% a year. (Illustrative scenario, consistent with the sourced real returns.) In money terms, the portfolio might have grown modestly, but after inflation it would have lost roughly a quarter of its purchasing power, with shares down about 18% and bonds about 33% in real terms. An investor holding part of the portfolio in commodities or gold would have fared far better.
Credibility matters
Inflation expectations became entrenched when the central bank was seen as willing to tolerate inflation. See why central bank independence matters to markets.
Stopping too early costs more
Easing before inflation was beaten let it return.
Stocks and bonds can fall together
This happens when inflation is the main risk, as in 2022. See why the stock-bond correlation flipped after 2021.
What differs today
Economies use less oil per unit of output, central banks target inflation explicitly and have built credibility since the 1980s.
Volcker’s turn
When Paul Volcker became Fed chair in August 1979, inflation was above 14%. In October 1979, the Fed shifted its approach to controlling the money supply, allowing interest rates to rise as far as needed. The federal funds rate reached about 20% by June 1981. The economy went through back-to-back recessions in 1980 and 1981–1982, and unemployment rose sharply, but inflation fell below 3% by 1983. The pain established the Fed’s credibility for the following decades.
The aftermath in markets
Once inflation was broken, bond yields began a decline that lasted almost four decades, producing one of the longest bull markets in bonds in history. Shares began a powerful rally from 1982. Gold and commodities, the winners of the 1970s, lagged for years. The turn showed how completely market leadership can change when the inflation regime changes. See market leadership by decade.
Echoes in 2022
When inflation surged in 2021 and 2022, comparisons with the 1970s became common. Shares and bonds fell together, commodities rose and central banks raised rates rapidly. The key difference was credibility: long-term inflation expectations stayed relatively anchored, and inflation fell faster than in the 1970s. See what 2022 taught investors about diversification.
Bonds in the 1970s
Bondholders suffered as inflation rose faster than expected, eroding the value of fixed payments. Long-term yields climbed through the decade, so bond prices kept falling, and investors who bought long bonds early in the decade lost heavily in real terms. By 1981, long-term Treasury yields were in the mid-teens, setting the stage for the long bond rally that followed once inflation fell.
The wage-price spiral
As prices rose, workers demanded higher wages to keep up, and companies raised prices to cover higher wage costs. Many wage contracts were linked to inflation, which helped embed it. Breaking that spiral required convincing workers and companies that inflation would fall, which is why credibility, not just higher rates, was central to Volcker’s success.
Currencies in the 1970s
After the end of the gold link, major currencies began to float. The dollar weakened sharply against the Deutsche mark, Swiss franc and yen during periods of high US inflation. Countries with more credible central banks, such as West Germany, kept inflation lower and saw their currencies strengthen.
Lessons for today’s central banks
Modern central banks draw three lessons from the decade: act early before inflation expectations rise, do not ease too soon and protect independence from short-term political pressure.
Common misreadings
- Blaming the 1970s only on oil.
- Assuming high inflation always helps gold.
The stagflation trap
The decade combined high inflation with weak growth and rising unemployment, a mix later called stagflation. It challenged the belief that inflation and unemployment move in opposite directions, and it left policymakers with no easy choice: easing to support jobs risked more inflation, while tightening risked deeper recession. Ultimately, the Fed chose to fight inflation first, accepting the recessions that followed.
Price controls
The wage and price controls of 1971 to 1974 suppressed inflation temporarily, but when they were removed, prices jumped. Controls also caused shortages, as producers had little reason to supply goods at capped prices. The experience convinced most economists that controls cannot replace sound monetary policy.
Housing and borrowing
Mortgage rates rose into the high teens by the early 1980s, making homes far less affordable and crushing housing activity. Borrowers who had locked in fixed rates earlier in the decade benefited, as inflation reduced the real value of their debt, while savers suffered as interest rates lagged inflation for much of the decade.
How investors adapted
Investors moved toward real assets, such as property, gold and commodities, and toward short-term instruments whose rates adjusted with inflation. Money market funds grew rapidly, offering higher yields than bank deposits, which were capped by regulation at the time.
Signs to watch today
Economists watch long-term inflation expectations, wage growth, central bank independence and energy prices as the main warning signs of a return to 1970s-style inflation. A combination of several, rather than any single one, would be the real concern.
Lessons for traders
The 1970s showed that inflation regimes can last years and that assets that work in one regime can fail in the next. Traders who recognized the shift early, from bonds and growth shares toward commodities and gold, did well, but many held those positions too long and suffered when the regime turned in 1980. Watching for a change in central bank resolve, not just inflation data, was the key to timing both shifts.
The decade in numbers
Inflation rose from 3.2% in 1972 to over 11% by 1975 and peaked at 14.8% in March 1980, before falling below 3% by 1983. Gold rose from $35 to $850, while shares and bonds lost in real terms.
Frequently asked questions
Could 1970s-style inflation return?
It is possible if several shocks combine with a loss of central bank credibility, but modern economies are less energy-intensive and central banks have stronger frameworks.
What did best in the 1970s?
Commodities and gold, which rose sharply, while both shares and bonds lost money after inflation.
This article is educational content and does not constitute financial, investment, legal or tax advice. Digital assets are volatile and you may lose the amount you invest.
Sources
- The Volcker Mistake (inflation peaked at 14.8% in March 1980, below 3% by 1983; funds rate to 20% in June 1981) — Motley Fool discussion citing Federal Reserve history
- The Awful Economy Paul Volcker Inherited in 1979 (S&P 500 −18% real 1966–1979; 10-year Treasuries −33% real) — A Wealth of Common Sense
- An Unlikely Hero in the US’s Last Battle with Inflation (3.2% in 1972; over 11% by 1975; over 14% in 1979) — Propmodo
- The stagflation beast is stirring (1973 embargo quadrupled oil prices) — Bank of Finland Bulletin
- Gold Price in the 1970s (Nixon ended dollar-gold convertibility on August 15, 1971; gold peaked at $850 on January 21, 1980, a nominal record that stood for nearly 28 years) — MetalCharts, LBMA data
- Yes, This is Stagflation (Nixon’s pressure on Burns ahead of the 1972 election) — Luckbox Magazine