
How Long Bull Markets Have Lasted, and What Ended Them
Bull markets have ranged from short recoveries to decade-long advances. History shows they end for different reasons, not because they become too old.
How long bull markets last varies enormously: they have lasted from months to more than a decade, which makes age a poor reason to expect one to end. S&P Dow Jones Indices estimates that S&P 500 bull markets have averaged roughly five years over its live history. The endings came from different combinations of recession, inflation, valuation, leverage and shock.
The 20% rule is a label, not an economic law
A bull market is commonly defined as a rise of at least 20% from a prior low.
S&P Dow Jones Indices uses a related framework in its historical work: a bull begins after a bear-market low and continues until the index reaches a high that is followed by a 20% decline.
The definition is useful because it gives researchers a consistent way to classify history.
It is still arbitrary.
A market that falls 19% has not experienced a fundamentally different economic event from one that falls 21%. The label helps organize data; it does not explain what caused the cycle.
The average bull market has lasted years, not months
S&P’s long-run S&P 500 material reports that bull markets over the index’s live history lasted about five years on average and gained roughly 160% in price terms.
The average hides a huge range.
Some advances were short recovery bursts. Others lasted through several earnings cycles, policy shifts and geopolitical events.
A bull market can survive bad headlines, corrections and even a recession scare without losing the long-term structure. What matters is whether the forces supporting earnings and valuation remain stronger than the forces working against them.
Age alone has never been the trigger.
The long 1980s–1990s advance ended in valuation excess
One of the great US equity advances ran through disinflation, falling long-term interest rates, globalization and the technology boom.
By the late 1990s, information technology had become an enormous share of the market, and valuations in many internet-related companies assumed extraordinary future growth.
The technology itself was real. The price paid for some of that growth was not sustainable.
The Nasdaq peaked in March 2000, and the broader market entered a long decline. S&P Dow Jones Indices dates the dot-com crash from September 2000 to October 2002 in one of its market-period studies.
The bull market did not die of old age. It ended when expected returns, valuations and business outcomes stopped matching.
The 2002–2007 bull ended with leverage, not expensive technology
The next major cycle had a different engine.
Credit expanded. Housing boomed. Financial balance sheets became more leveraged. Structured products spread risk through a system whose vulnerabilities were not fully understood.
The S&P 500 advanced from the 2002 low into October 2007.
Then housing losses moved through the financial system, funding markets tightened and the US economy entered a recession in December 2007 according to the NBER.
The end mechanism was not the same as in 2000.
One bull market ended with a technology-valuation collapse. The next ended with a credit and banking crisis.
That difference is why “what usually ends a bull market?” has no one-factor answer.
The 2009–2020 bull survived repeated reasons to worry
The post-financial-crisis bull market became one of the longest in US history.
It lived through the euro-area sovereign-debt crisis, repeated US fiscal disputes, a commodity collapse, the 2015–2016 growth scare, trade tensions and the sharp fourth-quarter selloff of 2018.
S&P Dow Jones Indices measures the post-GFC bull period from March 9, 2009 to February 19, 2020, with a total return above 500% in its sector-cycle study.
What finally ended it was not gradual age-related exhaustion.
COVID-19 created a sudden global economic stop. The S&P 500 fell about 34% from February 19 to March 23, 2020.
The longest expansion in NBER history also ended in February 2020.
A shock did in weeks what years of “this bull market is old” commentary had failed to do.
The 2020–2022 bull ended when the discount rate changed
The recovery after the pandemic crash was exceptionally fast.
Policy support was enormous, financial conditions eased, earnings recovered and investors paid higher valuations for growth.
Then inflation accelerated.
The Federal Reserve shifted toward aggressive tightening, bond yields rose and the present value of long-duration earnings fell. The S&P 500 entered a bear market in 2022 even though the US economy did not experience a contemporaneous NBER recession.
This cycle matters because it shows that a bull market can end through valuation and rates rather than a collapse in current economic activity.
The price of money can be enough.
What has actually ended bull markets
Historical bull-market endings tend to fit one or more of five categories.
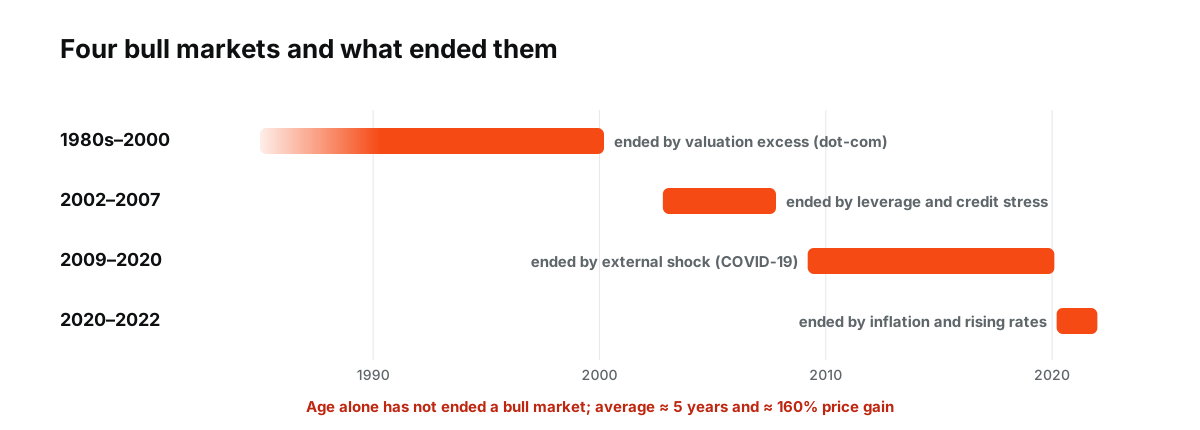
Figure: Bull markets in this article and what ended them. On average S&P 500 bull markets lasted about five years and gained roughly 160% (S&P Dow Jones Indices).
1. Recession and earnings contraction
A broad slowdown reduces revenue and profits while raising uncertainty.
2. Inflation and policy tightening
Higher inflation can force central banks to raise rates, increasing discount rates and financing costs.
3. Valuation excess
Prices can move so far ahead of achievable cash flows that even good fundamental outcomes disappoint.
4. Financial leverage and credit stress
A heavily leveraged system can amplify relatively small losses into forced deleveraging.
5. External shock
War, pandemic or another sudden event can rapidly alter expected cash flows and risk premiums.
The categories overlap. The 1970s mixed inflation, recession and oil shocks. The global financial crisis mixed leverage, recession and valuation. Market history does not keep causes neatly separated.
Corrections are not the same as endings
Bull markets contain drawdowns.
An index can fall 10%, 15% or more while the broader advance eventually resumes. Those corrections can reset positioning and valuations without changing the underlying economic regime.
This is one reason bull-market age is a poor timing tool.
A five-year-old bull can be healthy after a correction. A one-year-old bull can end if leverage or a shock overwhelms it.
The condition of the cycle matters more than the birthday.
A mature bull market leaves clues, not an expiry date
Useful warning signs are usually about fragility:
- earnings expectations stop improving;
- market breadth narrows sharply;
- valuations depend on increasingly optimistic assumptions;
- credit spreads widen;
- real yields rise quickly;
- leverage becomes more important to returns;
- leadership becomes concentrated in a small group of stocks.
None of those guarantees an ending.
Together, they tell you whether the market has less room for disappointment.
That is a more useful question than whether the bull market has exceeded its historical average duration.
History argues against the idea of a fixed lifespan
The average bull market lasts several years. No bull market is required to last the average.
Economic expansions vary. Inflation regimes vary. Market structure changes. Sector weights change. Policy reactions change.
A long-running bull can continue because profits keep compounding and financial conditions remain supportive. A young bull can fail because the assumptions behind it break.
History gives a distribution, not a countdown clock.
The ending starts when the underlying story changes enough that investors demand a lower price for future earnings. Sometimes that change builds slowly. Sometimes it happens in a month.
Bull markets elsewhere
Bull markets in other countries have followed their own timelines. Japan’s market peaked in 1989 and took 34 years to regain its high, showing that a bull market’s end can be followed by decades of weakness when valuations were extreme. European markets have had shorter and less powerful bull runs than the US in recent decades, partly because their indices contain fewer fast-growing technology companies. See why it took the Nikkei 34 years to regain its 1989 peak.
Recent bull markets in brief
| Period | Ended by |
|---|---|
| 2002–2007 | Credit crisis and recession |
| 2009–2020 | Pandemic shock |
| 2020–2022 | Inflation and rate rises |
Each began amid deep pessimism and ended for a different reason, which is why no single warning sign covers them all.
What it means for index traders
For traders, the age of a bull market is less useful than its conditions: whether earnings are rising, how high valuations are, what central banks are doing and whether credit is tightening. Positions sized for the volatility of a late-stage market, when corrections can be sharp, are more resilient than positions sized for the calm of earlier years. See what happens to stocks after a 10% correction and what moves stock market indices.
The bear markets in between
Every bull market ends in a bear market, and how a bear market ends shapes the next advance. Many of the strongest bull runs began from deep pessimism, when valuations were low and policy was turning supportive. Understanding that sequence helps put the age of a bull market in context. See how bear markets end. Bull markets that start from depressed valuations have more room to run than those that begin from expensive levels.
Frequently asked questions
What is the longest US bull market?
The run from March 2009 to February 2020 is often cited as the longest, at about 11 years.
Do bull markets end because they get old?
No. They have ended because of recessions, inflation and rate rises, excessive valuations, leverage or external shocks, not because of age.
This article is educational content and does not constitute financial, investment, legal or tax advice. Digital assets are volatile and you may lose the amount you invest.