
Does \”Sell in May and Go Away\” Hold Up?
The Sell in May effect appeared in historical research, but later evidence is weaker. See what the seasonality means and why it is unreliable alone.
“Sell in May and go away” describes a historical tendency for stock returns to have been stronger from November through April than from May through October. The pattern appeared in influential academic research across many markets, but later studies found that it weakened in more recent samples. It is seasonality, not a dependable timing rule.
The phrase is really about two six-month windows
The strategy is often described more dramatically than the research behind it.
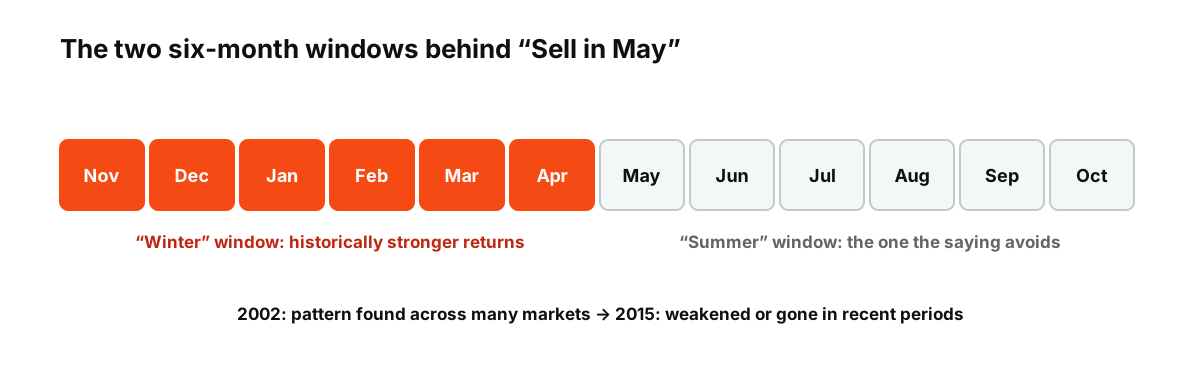
Figure: The two windows behind the saying. Bouman and Jacobsen (2002) documented the gap; a 2015 study found it weakened or disappeared in recent periods.
The basic test compares equity-market returns during:
- November through April, sometimes called the winter period; and
- May through October, sometimes called the summer period.
If the first window consistently produces higher returns, an investor could theoretically hold stocks in winter and move to cash in summer.
The idea is also known as the Halloween indicator, because the equity-holding period begins around the end of October.
That sounds wonderfully simple. Markets have a habit of making simple rules expensive once everyone learns them.
The 2002 study made the effect famous in academic finance
Sven Bouman and Ben Jacobsen published an influential paper in the American Economic Review in 2002 examining the Halloween indicator across international stock markets.
Their evidence suggested that returns in the November-April period were meaningfully stronger than in May-October in many countries, with the pattern especially notable in Europe. The result was difficult to explain through standard risk-based models, which is why it became known as an anomaly.
The paper did not prove that every summer period loses money. It showed a difference in average historical returns across the two windows.
That distinction is important. An average seasonal effect can coexist with many individual years that do the opposite.
Seasonality is not the same as a trading signal
Suppose a historical sample shows average winter returns of 8% and average summer returns of 2%. That does not mean the next summer return will be 2%, or even positive.
The range around the averages may be huge.
A major earnings surprise, recession, war, policy shift or liquidity event will overwhelm a calendar tendency. In most years, the market is reacting to information that has nothing to do with the month printed at the top of the screen.
Seasonality is best treated as a weak prior: something that may slightly shift the historical distribution, not something that replaces analysis of valuation, earnings or macro conditions.
Later research found the effect became less convincing
A 2015 study published in the International Review of Financial Analysis revisited the Halloween effect and found that it had strongly weakened or disappeared in more recent periods across several markets.
That is exactly what should make traders cautious with famous calendar rules.
An anomaly can weaken for several reasons:
- Investors learn about it. If enough capital trades the pattern, prices adjust earlier.
- Market structure changes. Trading costs, global capital flows and institutional participation evolve.
- The original sample may contain luck. With enough possible seasonal patterns, some will look unusually strong by chance.
- The economic mechanism may change. A behavior linked to old vacation, tax or liquidity patterns may fade.
A published historical effect is not guaranteed to survive contact with a different market structure.
Transaction costs are no longer the main problem
When the strategy first became popular, switching a portfolio twice a year created meaningful commissions and spreads for many investors.
Those costs have fallen sharply in many markets.
That does not make the strategy stronger. It simply removes one friction.
The larger issue is opportunity cost. Some of the strongest equity rallies occur during periods that a strict Sell-in-May rule would classify as the weak half of the year. Missing a small number of large up days can matter more than avoiding months with slightly lower average returns.
A cash position also earns a different return depending on the interest-rate environment. A seasonal strategy tested in an era of high cash yields is not directly comparable with one used when cash yields are near zero.
The effect is difficult to separate from other market patterns
Calendar anomalies overlap.
January has its own famous effect. Tax-loss selling can influence year-end behavior. Earnings seasons recur quarterly. Fiscal years differ across countries. Holidays change liquidity. Elections and central-bank cycles can create patterns that happen to line up with parts of the calendar.
That makes a clean economic explanation for Sell in May difficult.
If a pattern has no stable mechanism, confidence in its future persistence should be lower than confidence in a relationship with a clear causal chain.
A strong summer can break the rule without disproving the history
One of the easiest mistakes is to judge a long-run anomaly by one year.
If equities rally from May through October, people say the rule is dead. If they fall, the phrase returns to headlines.
Neither tells you much.
A seasonal effect is a statement about a distribution across many observations. The relevant questions are whether the average difference remains statistically meaningful, whether it survives out of sample, and whether it still matters after costs and risk.
Those tests are much tougher than finding a memorable chart.
Why the phrase survives even when the edge weakens
“Sell in May and go away” has an advantage most investment research does not: it rhymes.
Memorable rules spread faster than conditional ones.
Compare:
Stocks have sometimes shown higher average returns from November through April, but the magnitude varies by market and time period.
with:
Sell in May and go away.
The second version will win every dinner conversation. It also loses most of the uncertainty.
Financial-market folklore often survives because it compresses a complicated historical observation into a sentence people can remember. That makes it useful as a research question and dangerous as an automatic rule.
The better use is as a check, not a calendar command
Seasonality can be one input when it agrees with more important evidence.
If valuations, earnings revisions, liquidity, policy and positioning already point toward a fragile market, a historically weaker seasonal window may add context. If those variables point the other way, the calendar should not overrule them.
The historical research behind Sell in May is real. So is the evidence that the effect has not been equally strong in every period.
That leaves a less catchy conclusion: the anomaly is interesting enough to measure, but not stable enough to run the whole decision process.
Applying the idea, illustrated
Suppose an investor follows the rule strictly: holding an index fund from November to April and cash from May to October. (Illustrative figures.) In a year when the index gains 6% in the winter half and loses 2% in the summer, the rule earns the 6% and avoids the loss. In a year when the index rises 4% in winter and 10% in summer, it earns only 4% and misses the stronger half entirely. Over many years, the outcome depends on how often summers are strong, and a few missed summer rallies can erase the benefit of the years when the rule worked.
Costs and taxes
Switching in and out of the market twice a year creates trading costs and, for taxable investors, may realize gains that would otherwise be deferred. Cash held over the summer earns interest, which helps in years when rates are high. These practical details can matter as much as the size of the seasonal difference itself.
Using seasonality with CFDs
For CFD traders, a seasonal tendency is at most a mild background factor. Holding a long index CFD through the winter months to capture a possible seasonal edge means paying financing every night, which can absorb a large share of a small average advantage. Leverage also turns ordinary summer swings into significant gains or losses, whatever the calendar says. See how stock index CFDs work.
Other calendar patterns
Sell in May is one of several calendar effects investors discuss, alongside the January effect, the year-end rally and patterns around holidays. Most share the same weakness: they appear in long historical averages but are unreliable in any single year and have tended to fade once widely known. See whether the January effect still exists.
What matters more than the calendar
Interest rates, earnings, valuations and the economic cycle have far more influence on returns in any given six months than the season. A summer with falling inflation and rising profits can be very strong; a winter with a recession can be very weak. See what moves stock market indices and how long bull markets last. Seasonal averages can describe the past well without really telling you much about the coming year’s markets.
Frequently asked questions
Does sell in May still work?
Later research found the effect weaker in more recent samples, and many recent summers have been strong. It is better seen as a historical tendency than a dependable rule.
Where does the phrase come from?
It is an old market saying, popular in London, that advised investors to sell in spring and return in autumn.
This article is educational content and does not constitute financial, investment, legal or tax advice. Digital assets are volatile and you may lose the amount you invest.