
What Moves Silver Prices?
Silver moves with gold, industrial demand from solar and electronics, supply deficits, the dollar and flows. Why it is so volatile, with the 2025–2026 swings.
Silver prices move on monetary and industrial forces: gold’s direction, demand from solar panels and electronics, mine supply against demand, the dollar and investor flows. Its market is much smaller than gold’s, so swings are larger: silver doubled in 2025, topped $109 in January 2026 and traded near $59 by late June.
Silver’s 2025–2026 ride
Silver’s recent swings show how quickly its drivers can combine. It doubled in 2025, then surged to a record $109.33 an ounce on January 26, 2026, supported by strong investment demand, a fifth year of supply deficits and record industrial use. It was trading near $92 in late February, then fell to about $59 by late June, a drop of roughly 46% from the peak. Few major markets move that much in five months, which is why silver is often described as gold with extra volatility.
Gold and the precious metals cycle
Silver often follows gold, lagging early in a rally and then moving faster. See how to calculate and use the gold-silver ratio.
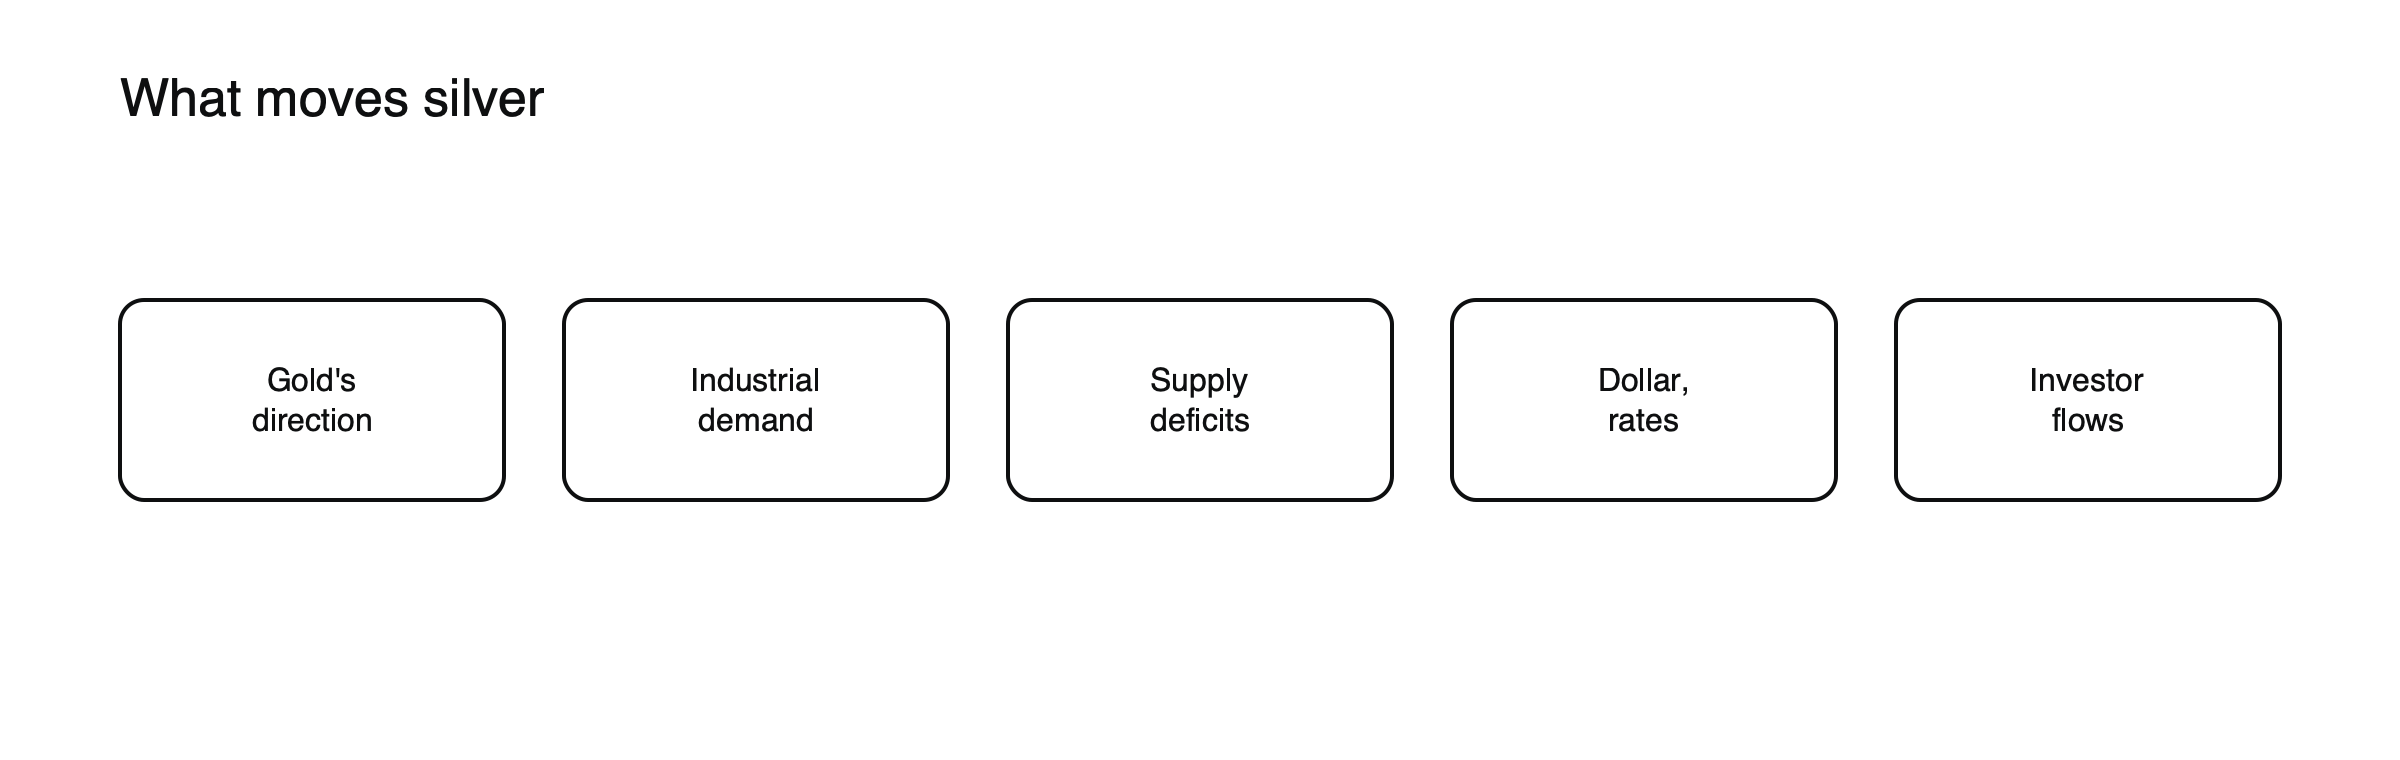
Figure: The main silver drivers.
Industrial demand
Solar panels, electronics and electrification account for a large and growing share of demand, so the economic cycle matters more for silver than for gold. Industrial demand reached records in recent years.
Where demand comes from
| Source | Role |
|---|---|
| Industry | Electronics, electrical parts, solar panels, electric vehicles |
| Investment | Bars, coins and exchange-traded funds |
| Jewelry and silverware | Especially in India |
| Photography | A small and shrinking share today |
Industrial uses make up a large share of total demand, which is the main difference from gold.
Solar power
Silver paste is used in most solar cells to conduct electricity, and the rapid growth of solar installations has added substantially to demand. Manufacturers try to use less silver per panel as prices rise, so higher prices can slowly reduce this demand, but the overall growth of solar has so far outweighed those savings.
Supply deficits
Demand has exceeded mine supply for several years, drawing down stocks and supporting prices.
Supply that cannot respond quickly
Most silver is mined as a by-product of other metals, such as lead, zinc, copper and gold. Because miners decide output based mainly on those metals, higher silver prices do not quickly bring more silver to market. This makes supply slow to respond to price, which is one reason deficits have persisted for several years and why shortages can push prices sharply higher.
The dollar and rates
Like gold, silver is priced in dollars and pays no interest, so a weaker dollar and lower real yields tend to help. See why gold falls when real yields rise.
Investor flows
ETF buying, retail demand and speculative positioning can amplify moves in a thin market. See how to use the Commitments of Traders report.
See gold vs silver: how their drivers differ and how commodity CFDs work.
Thin markets and squeezes
Silver’s market is small enough that large buyers have occasionally tried to dominate it. The most famous attempt, by the Hunt brothers around 1980, drove prices to extreme levels before they collapsed. In modern markets, coordinated retail buying and tight physical stocks have caused sudden spikes. These episodes show that silver can move far beyond what its fundamentals suggest for short periods. See what happened when the Hunt brothers tried to corner silver.
Drivers by time horizon
| Horizon | Main drivers |
|---|---|
| Hours to days | Gold moves, US data, the dollar, positioning |
| Weeks to months | Investor flows, industrial outlook, inventory levels |
| Years | Supply deficits, solar and electronics demand, mine output |
Sizing silver positions
Silver can move 3% to 5% in a day during volatile periods. Under EU retail rules, it carries a 10:1 leverage cap, so a 10% move against a position uses up its entire margin. Sizing silver positions from the risk you are willing to take, using a stop that reflects its recent daily range, keeps its volatility from overwhelming the account. See how to size a CFD position using risk per trade.
The ratio in 2026
Silver’s moves relative to gold show up in the gold-silver ratio. On February 27, 2026, with gold at $5,246.70 and silver at $92.02, the ratio was about 57; by June 26, with gold at $4,063.17 and silver at $59.04, it had risen to about 68.8. Silver fell further than gold as the rally faded, a typical pattern when precious metals turn lower. See how to calculate and use the gold-silver ratio.
Watching the industrial cycle
Because industry is such a large buyer, signs of manufacturing strength or weakness matter for silver. Purchasing managers’ surveys, Chinese industrial data and solar installation figures all feed into expectations for demand. A strong manufacturing upturn can lift silver even when gold is quiet, while a slowdown can weigh on it even during a gold rally.
Inventories and physical premiums
Stocks of silver held in exchange and London vaults show how much metal is readily available. When inventories fall and buyers pay higher premiums for physical bars and coins, the market is tight, and prices can react sharply to new demand. When inventories rebuild, that pressure eases. These physical signals often explain moves that futures prices alone do not.
A silver checklist
- What is gold doing, and where is the gold-silver ratio?
- Is the manufacturing outlook improving or weakening?
- Are inventories falling and physical premiums rising?
- What are the dollar and real yields doing?
- How crowded is speculative positioning?
Common misreadings
- Treating silver as a slower version of gold.
- Ignoring industrial demand.
- Assuming deficits must push prices up every year.
Demand in India and elsewhere
India is one of the largest buyers of silver for jewelry, silverware and investment, and its imports can swing sharply with prices and local festivals. When prices fall, Indian buyers often step in; when prices spike, they hold back. That price-sensitive demand can soften falls and slow rallies, and import data from India are watched as a guide to physical demand.
Silver and other industrial metals
Silver often moves with copper and other industrial metals when the economic outlook changes, because all of them depend on manufacturing and construction. But silver also responds to gold, interest rates and safe-haven demand, which copper largely ignores. On days when copper and gold move in opposite directions, silver can be pulled both ways, and its reaction shows which influence is stronger at that moment. See what moves copper prices.
Silver in a portfolio
Some investors hold a small amount of silver alongside gold for its greater sensitivity to rallies in precious metals and to industrial growth. Because silver can fall much further than gold in a downturn, it is usually held in smaller amounts. For traders, its volatility makes it suitable mainly for shorter-term positions with clear stops and modest size. Sizing silver by its daily range, rather than by money invested, keeps those swings in proportion to the account.
Frequently asked questions
Why is silver more volatile than gold?
Its market is smaller, it depends more on industrial demand and it has fewer large, steady buyers such as central banks, so the same flows move it more.
Does a recession hurt silver more than gold?
Usually. Industrial demand weakens in a downturn, while gold benefits more from safe-haven buying, so the gold-silver ratio tends to rise.
This article is educational content and does not constitute financial, investment, legal or tax advice. Digital assets are volatile and you may lose the amount you invest.
Sources
- Gold surges past $5,000 and silver tops $100 (silver $109.33 on January 26, 2026; silver doubled in 2025) — Barchart
- Precious metals outlook 2026 (silver above $60 in 2025; physical deficits in silver; silver lags then moves with greater intensity; ratio above 100 then at or below 60) — CME Group, 2026
- Annual outlook 2026 (record-high industrial demand for silver; market deficit 2021–2025) — HDFC Securities, January 2026
- Gold rebounds above $4,060 (silver $59.04, June 26, 2026) — USAGOLD
- Gold spot price surges past $5,246 (silver $92.02 on February 27, 2026) — USAGOLD
- ESMA adopts CFD measures (gold 20:1; commodities other than gold 10:1) — Finadium