
What Caused the 2016 Pound Flash Crash?
On October 7, 2016, sterling fell about 6% in two minutes of early Asian trading. What happened, what the BIS found about liquidity and algorithms, the lessons.
The pound flash crash came on October 7, 2016, when sterling fell about 6% in two minutes of early Asian trading, to a 31-year low near $1.18, before recovering much of the drop. A Bank for International Settlements review found no single cause: thin liquidity, stop-loss and hedging orders, and algorithms combined.
The backdrop: a currency already under pressure
The flash crash did not come out of a calm market. Sterling had fallen sharply after the UK voted to leave the European Union on June 23, 2016, and in the week before the crash it lost about 4% more as the new government under Theresa May signalled a firm break with the EU and markets grew worried about a “hard Brexit.” Comments from the Prime Minister about the side effects of loose monetary policy added to the nervousness. Many traders were already short sterling, many had stop-loss orders below key levels, and options positions linked to those levels were large. That combination left the market primed for a sudden move.
Timeline
- June 2016: after the EU referendum, sterling has already fallen about 17%.
- October 6–7, 2016: concern about a “hard Brexit” builds.
- Shortly after Asian markets open: sterling drops from about $1.26 to about $1.18 within minutes; some platforms record lower prints.
- Minutes later: it recovers to around $1.24.
- January 2017: the BIS Markets Committee publishes its report, finding a confluence of factors and no evidence of market abuse.
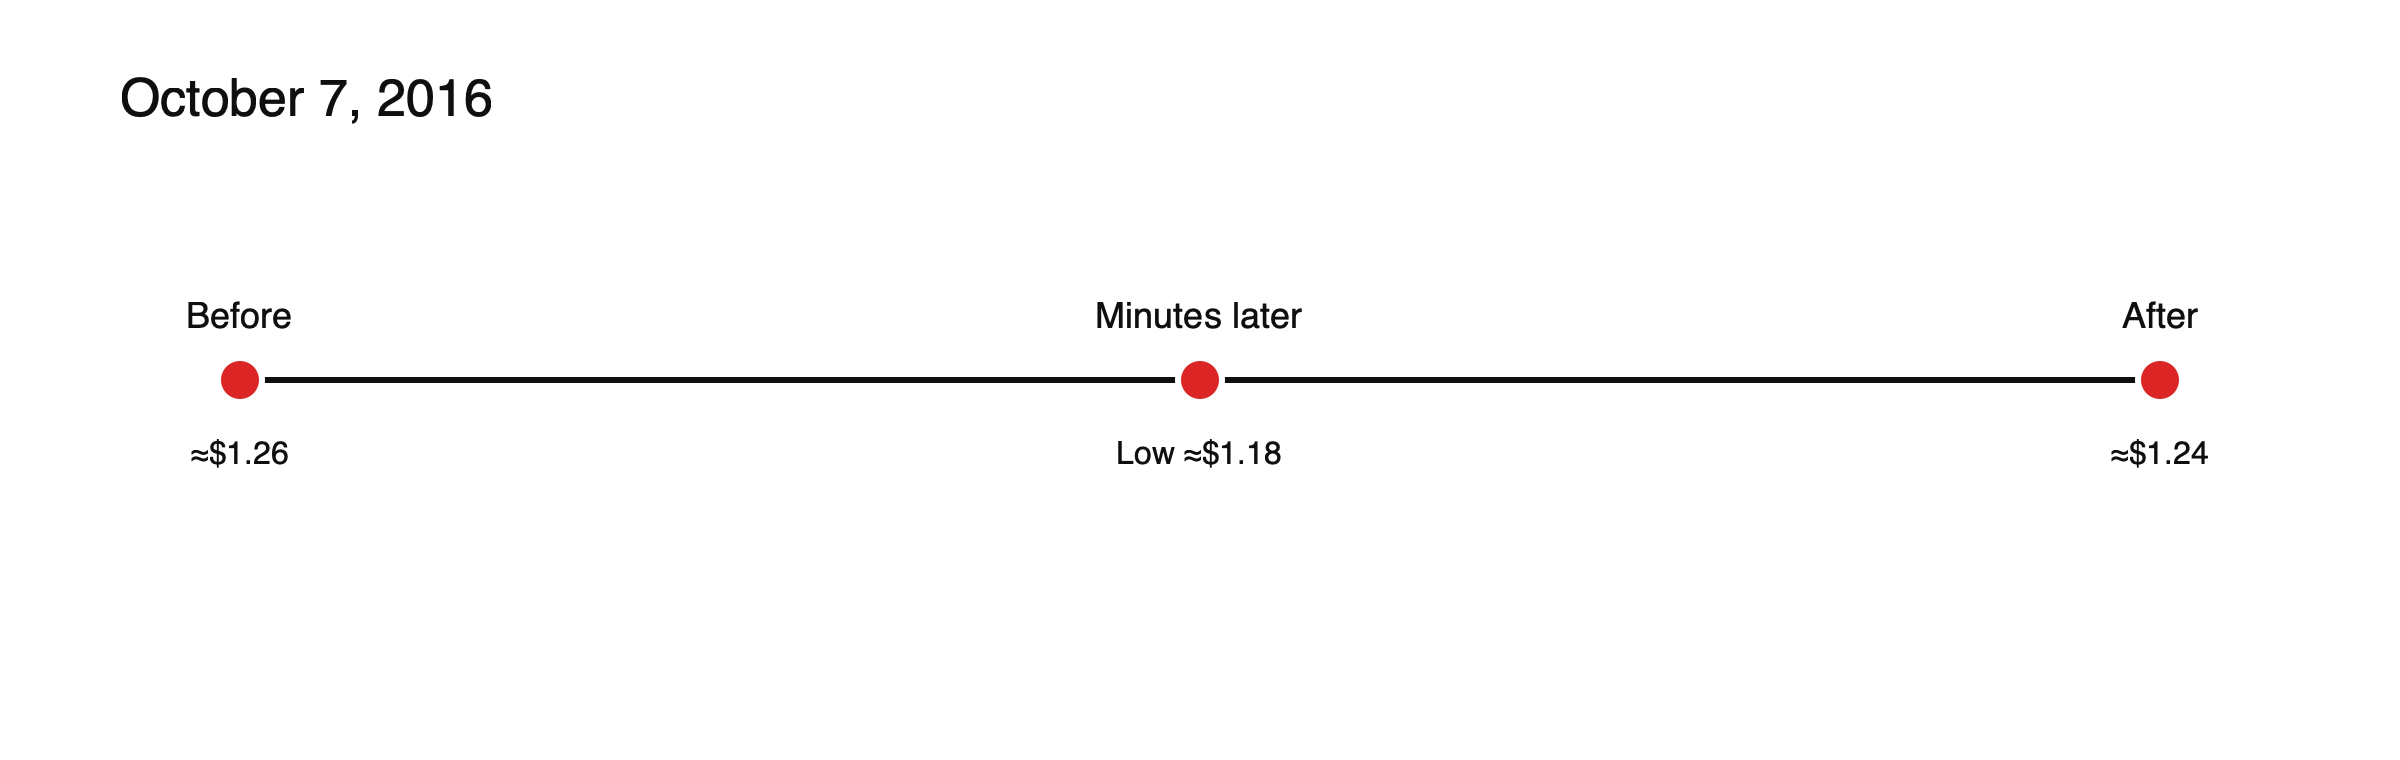
Figure: Two minutes in early Asian trading.
The two minutes, in detail
The fall happened between about 8:07 and 8:09 a.m. Tokyo time on Friday, October 7, just after midnight in London and in the evening in New York, a window when most dealers in London and New York had gone home and Asian trading in sterling was only just beginning. Prices on different platforms told different stories: an early reported low was later revised by Thomson Reuters to $1.1491 after an outlying trade was cancelled, still the weakest level for sterling since 1985. Within minutes, the pound was back above $1.20 and later near $1.24, though it ended the week well down.
The headline that came too late
At first, many blamed a Financial Times article reporting that the French President, François Hollande, wanted tough Brexit negotiations. Later analysis found that the article appeared about 10 seconds after the fall had already begun. It may have added fuel, as algorithms that scan news reacted to a fast-moving market, but it did not start the move.
What caused it
Time of day: early Asian trading is among the least liquid periods for sterling.
Stops and hedging: as prices fell, stop-loss orders and options hedging added to the selling.
Algorithms: automated systems withdrew liquidity or added sell orders; staff less familiar with the algorithms amplified the move.
What the central bank report found
The report by the Markets Committee of the Bank for International Settlements, prepared with the Bank of England and published on January 13, 2017, studied the event in detail using high-frequency data from the inter-dealer platform Thomson Reuters Matching and the Chicago Mercantile Exchange’s currency futures. It described the move as a flash event in three stages and placed most weight on the time of day and on mechanical amplifiers, including hedging linked to options. It found no single cause and no evidence of market abuse, and it compared the episode with earlier flash events, such as a sudden move in US Treasury bonds in October 2014, concluding that such events were becoming more common across markets.
Why it matters for retail traders
For anyone holding sterling positions with leverage that night, the outcome depended heavily on their broker’s prices and stops. A stop placed at $1.2400 on a long position might have filled anywhere in a range of several cents, depending on the platform, and some brokers later adjusted or reviewed fills. Positions on high leverage could be closed out at prices that existed only for seconds. The episode is one of the clearest demonstrations that stop-losses limit losses only in normal markets, and that thin trading hours carry extra risk even in a major currency. See what happens in a margin call and a stop-out.
A stop order’s journey through a flash crash
Suppose a trader held 1 lot of GBP/USD long from 1.2600 with a stop at 1.2400, planning to lose at most 200 pips, about $2,000. (Illustrative example.) When the price collapsed through 1.2400 in seconds, the stop became a market order in a market with almost no buyers. If it filled at 1.1900, the loss was 700 pips, about $7,000, three and a half times the plan, even though the price was back above 1.2400 minutes later. A trader with no stop at all would have recovered most of the move, which is the uncomfortable lesson of flash crashes: the protection that works in normal markets can lock in the worst price in abnormal ones. Smaller positions, rather than tighter stops, are the main defense.
How brokers handled the event
Brokers’ experiences varied. Some platforms showed much lower prices than others, depending on where they sourced quotes. Some reviewed trades executed at extreme prices, and client agreements typically allow for the correction of obvious pricing errors. Traders who check how their broker treats trades in extreme conditions, and which price feeds it uses, are better prepared before the next event.
A checklist for thin trading hours
- Are any positions large enough that a sudden 5% move would seriously hurt the account?
- Are stops placed at obvious round numbers where many others cluster?
- Is a major announcement due before the next liquid session?
- Would reducing size before the quiet hours cost very much at all?
Lessons
- Even major currencies can gap in thin hours.
- Stops can fill far from their levels. See how stop-loss orders work.
- Spreads widen sharply when liquidity disappears. See what spread widening is.
The episode led to new principles on algorithmic trading in the FX Global Code. See what moves GBP/USD, forex trading sessions and how the forex market works.
Flash events since 2016
Sterling’s crash was not the last. Other sudden moves in thin markets have hit currencies such as the yen in early January 2019, again in early Asian trading after a holiday, when liquidity was unusually low. The pattern repeats: a quiet session, crowded positioning, stop orders clustered at obvious levels and automated systems that pull back when volatility jumps. Each episode has prompted more scrutiny of electronic trading and liquidity, but none has removed the basic risk of thin markets.
Frequently asked questions
Did the pound really fall to $1.14?
Prices recorded in those minutes varied by platform. After a cancelled outlier trade, Thomson Reuters put the low at $1.1491, while other venues recorded different levels. All agreed it was the lowest since 1985.
Was anyone found responsible?
No. The central bank review found a combination of factors, including time of day, hedging and automated trading, and no evidence of market abuse.
This article is educational content and does not constitute financial, investment, legal or tax advice. Digital assets are volatile and you may lose the amount you invest.
Sources
- Report on sterling “flash event” (about 9% depreciation; range of factors; time of day; FX Global Code lessons) — BIS, January 2017
- Flash crash of the pound baffles traders (6.1% drop to a 31-year low of $1.1841 in two minutes; down 17% since the referendum) — Markets Media, October 2016
- Sterling smashed in flash crash (from $1.26 to $1.18, then $1.24) — City A.M.
- Sterling flash crash had no single driver (stop-loss and options hedging; no data suggesting abuse) — CNBC / Reuters, January 2017
- The sterling “flash event” of 7 October 2016 (forensic study using Thomson Reuters Matching and CME data; three stages; time of day and options-related hedging) — BIS Markets Committee Paper No 9, January 13, 2017
- Britain’s pound “flash crashed” to a 31-year low (low revised to $1.1491 after a cancelled outlying trade; weakest since 1985; weekly loss of about 4%) — Reuters via Fortune, October 2016
- Analysis of the flash crash that hit the British pound (8:07–8:09 a.m. Tokyo time on a Friday; FT article appeared about 10 seconds after the fall began) — BSI Economics