
Why Does USD/JPY Follow US Treasury Yields?
USD/JPY often tracks the gap between US and Japanese yields. How the link works, why it held in 2022–2024 and when policy shifts or panics break it.
USD/JPY often moves with US Treasury yields because it reflects the gap between US and Japanese returns. When US yields rise while Japan’s stay low, dollars pay more, investors sell yen and USD/JPY climbs; the gap helped push the yen to about 160 in 2024. The link weakens when Japan’s policy shifts or markets panic.
How the link works
For years the Bank of Japan kept short-term rates near or below zero and capped 10-year yields. US yields, by contrast, moved with Fed policy. Rising US yields widened the gap, encouraging Japanese investors to buy foreign bonds and carry traders to borrow in yen. See what the carry trade is.
The gap in numbers
Suppose the US 10-year Treasury yields 4.5% and the Japanese 10-year government bond 1.0%. (Illustrative yields.) A Japanese insurer choosing between the two earns about 3.5 percentage points more a year by buying the US bond, as long as the yen does not rise enough to wipe out the extra return. When US yields climb further, the incentive grows and more yen is sold for dollars; when they fall, or Japanese yields rise, the incentive shrinks. That is why USD/JPY often moves almost tick for tick with US yields on the day of a major US data release.
Japanese investors and the cost of hedging
Japan’s large pension funds, insurers and banks hold huge amounts of foreign bonds. Many hedge part of their currency exposure, and the cost of that hedge depends on the gap between short-term rates in the two countries. When the gap is wide, hedging is expensive, so investors either buy foreign bonds unhedged, adding to yen selling, or stay at home. Changes in how much these institutions hedge can move USD/JPY for weeks, independently of daily data.
2022–2024: the gap at work
As the Fed raised rates fast, the yen fell from about 115 per dollar in early 2022 to around 160 in 2024, despite repeated Japanese intervention. Analysts noted the wide rate gap kept pushing against the yen. See what currency intervention is.
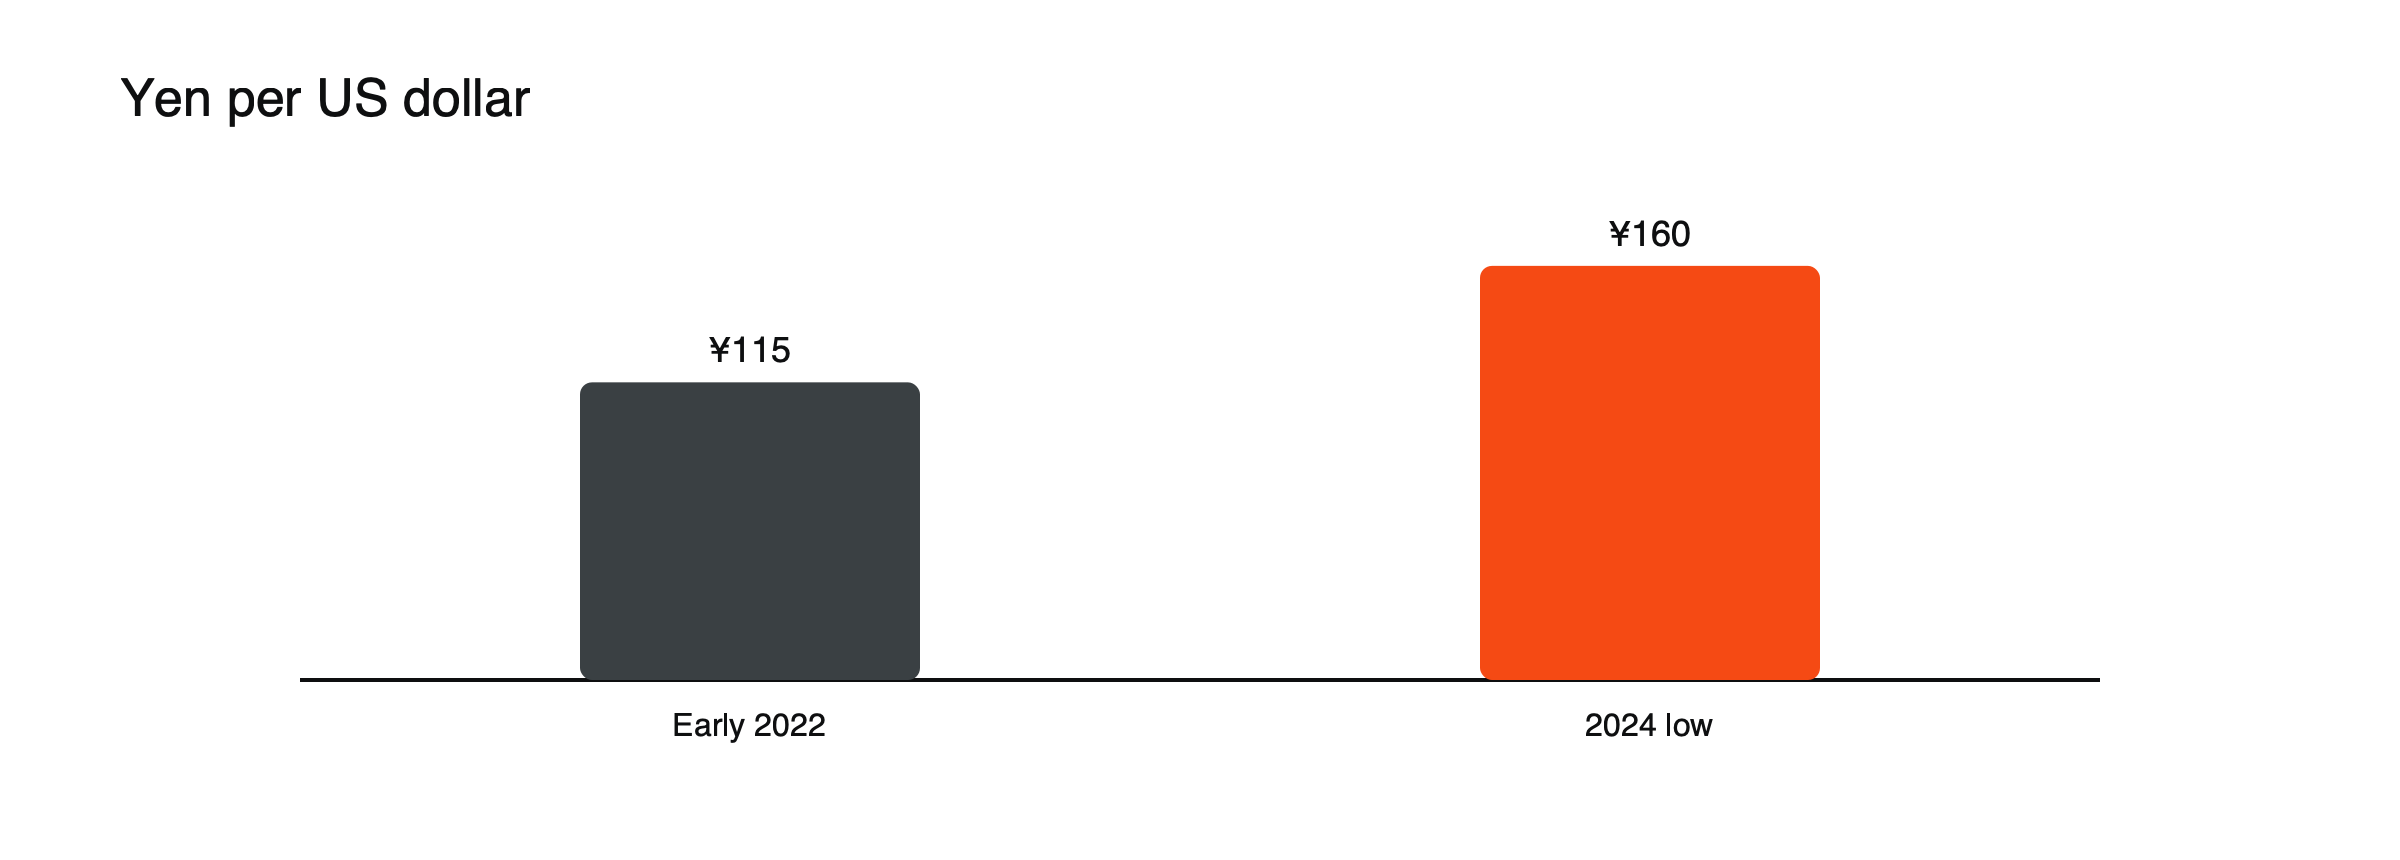
Figure: The yen’s fall as the US-Japan rate gap widened.
When the link breaks
- Japanese policy shifts: the Bank of Japan’s surprise change in December 2022 and its July 2024 rate hike lifted the yen sharply.
- Risk-off: in a panic, the yen can rise even if yields barely move. See what a safe-haven currency is.
Intervention
Japanese authorities can push the yen up suddenly by buying it in the market, as they did in 2022, 2024 and 2026, though the effect fades if the rate gap stays wide.
A record intervention year: 2026
The yen’s weakness returned in 2026. After it slid to about 160.7 per dollar at the end of April, Japanese authorities bought yen on April 30, pushing the dollar down by more than five yen within hours, and the finance ministry later confirmed spending about ¥11.7 trillion, roughly $73 billion, between late April and late May. The yen weakened again over the summer, and on July 31 Japan and the United States carried out their first joint intervention to support the yen since 1998. Finance ministry data showed ¥15.4 trillion, about $96 billion, spent between July 30 and August 26, the largest monthly amount on record. Even so, the yen gained only modestly, a reminder that intervention struggles while the interest rate gap remains wide.
Intervention at a glance
| Period | Yen spent | Context |
|---|---|---|
| October 2022 | About ¥6.35 trillion | Yen at multi-decade lows as the Fed raised rates |
| April–May 2024 | About ¥9.79 trillion | Yen beyond 160 per dollar |
| April–May 2026 | About ¥11.7 trillion | Yen near 160.7 per dollar |
| July–August 2026 | About ¥15.4 trillion | Joint action with the United States |
The USD/JPY data calendar
| Release | Why it matters |
|---|---|
| US jobs and inflation data | Move US yields and the dollar |
| Federal Reserve decisions | Set the US side of the rate gap |
| Bank of Japan decisions and outlook reports | Signal the pace of Japanese rate rises |
| Japanese wage and inflation data | Shape Bank of Japan expectations |
| Official comments from Tokyo on the yen | Warn of possible intervention |
What to watch
US 2- and 10-year yields, Japanese yields, Bank of Japan meetings and official warnings about the yen. See why the Bank of Japan ended yield curve control and what moves currency prices.
Practical notes for trading USD/JPY
USD/JPY is the second most traded currency pair and usually has tight spreads. A pip is 0.01, and on one standard lot it is worth about ¥1,000, around $6.67 at 150 yen per dollar. Both currencies are among those treated as major under EU retail rules, so leverage is capped at 30:1. The pair can trend for long periods on the rate gap, then reverse sharply on Japanese policy shifts, intervention or a flight to safety. Long positions also earn positive rollover when US rates are well above Japan’s, which can encourage holding too much for too long. See what forex rollover is and the 2024 yen carry trade unwind.
The yen as a safe haven
Japan is one of the world’s largest net creditors, with Japanese investors holding far more foreign assets than foreigners hold in Japan. In a crisis, some of that money tends to come home, and traders who borrowed yen to invest elsewhere rush to repay it. Both push the yen up, even when US yields are steady. That is why USD/JPY can fall sharply in a global sell-off, breaking its usual link with yields for days or weeks. See what a safe-haven currency is.
The end of yield curve control
For years the Bank of Japan capped long-term Japanese yields, which kept the rate gap wide whenever US yields rose. Each loosening of that cap, beginning with the surprise change in December 2022, let Japanese yields rise and tended to support the yen. As the bank moved toward normal policy and began raising rates, Japanese yields became a second moving part in the pair, alongside US yields. See why the Bank of Japan ended yield curve control.
When intervention meets a wide rate gap
The 2026 episodes showed the two forces colliding. Each intervention knocked several yen off USD/JPY within hours, yet the pair drifted back as long as US yields stayed well above Japanese ones. Traders who sold dollars right after an intervention often profited briefly; those who held on as the rate gap reasserted itself frequently gave the gains back.
Common misreadings
- Assuming USD/JPY must rise whenever US yields rise, regardless of risk sentiment.
- Treating official warnings as empty words; they have often preceded real intervention.
- Ignoring rollover costs on short USD/JPY positions held for long periods.
Frequently asked questions
Why does the yen weaken when US yields rise?
Because a wider gap between US and Japanese returns encourages investors to sell yen and buy dollar assets, and makes borrowing yen to invest elsewhere more attractive.
Can intervention reverse the yen’s trend?
It can cause sharp short-term moves, but history suggests it rarely changes the trend unless the interest rate gap also starts to narrow.
This article is educational content and does not constitute financial, investment, legal or tax advice. Digital assets are volatile and you may lose the amount you invest.
Sources
- Japan spent $62 billion supporting yen (yen from about 115 per dollar before February 2022 to a 34-year low in 2024) — AFP via Naharnet, May 2024
- Japan spent $62 bn to support yen (rate gap working against the yen) — Business Standard, May 2024
- Bank of Japan: yield curve surprise (December 2022 yen surge) — Principal Asset Management
- Carry trade unwind (July 2024 BoJ hike; yen +14%) — Schwab via Advisor Perspectives
- History of Japan’s intervention in currency markets (October 2022 ¥6.3499 trillion; April–May 2024 ¥9.79 trillion; joint US–Japan action on July 31, 2026) — Reuters via Investing.com, 2026
- Japan steps in to defend the yen (intervention on April 30, 2026, at about 160.7; dollar down more than 5 yen) — FN News, May 2026
- Japan’s record yen intervention called a success (¥11.7 trillion, about $73 billion, April 28–May 27, 2026) — Crypto Briefing, 2026
- Japan spent record $96 billion in yen interventions (¥15.4 trillion between July 30 and August 26, 2026; first joint US–Japan action in 28 years) — Kuwait Times / AFP, August 2026