
What Is a Credit Spread?
A credit spread is the extra yield a corporate bond pays over a government bond. How it is calculated, what widening and narrowing signal and recent extremes.
A credit spread is the extra yield a corporate bond pays over a government bond of the same maturity, for default and liquidity risk: corporate yield − government yield. If a 5-year Treasury yields 4.2% and a 5-year investment-grade bond 4.9%, it is 70 basis points. Spreads widen on default fears, narrow on confidence.
Worked example
- 5-year Treasury: 4.2%
- Investment-grade corporate: 4.9% → spread 0.70%, or 70 bp
- High-yield corporate: 7.8% → spread 3.60%, or 360 bp
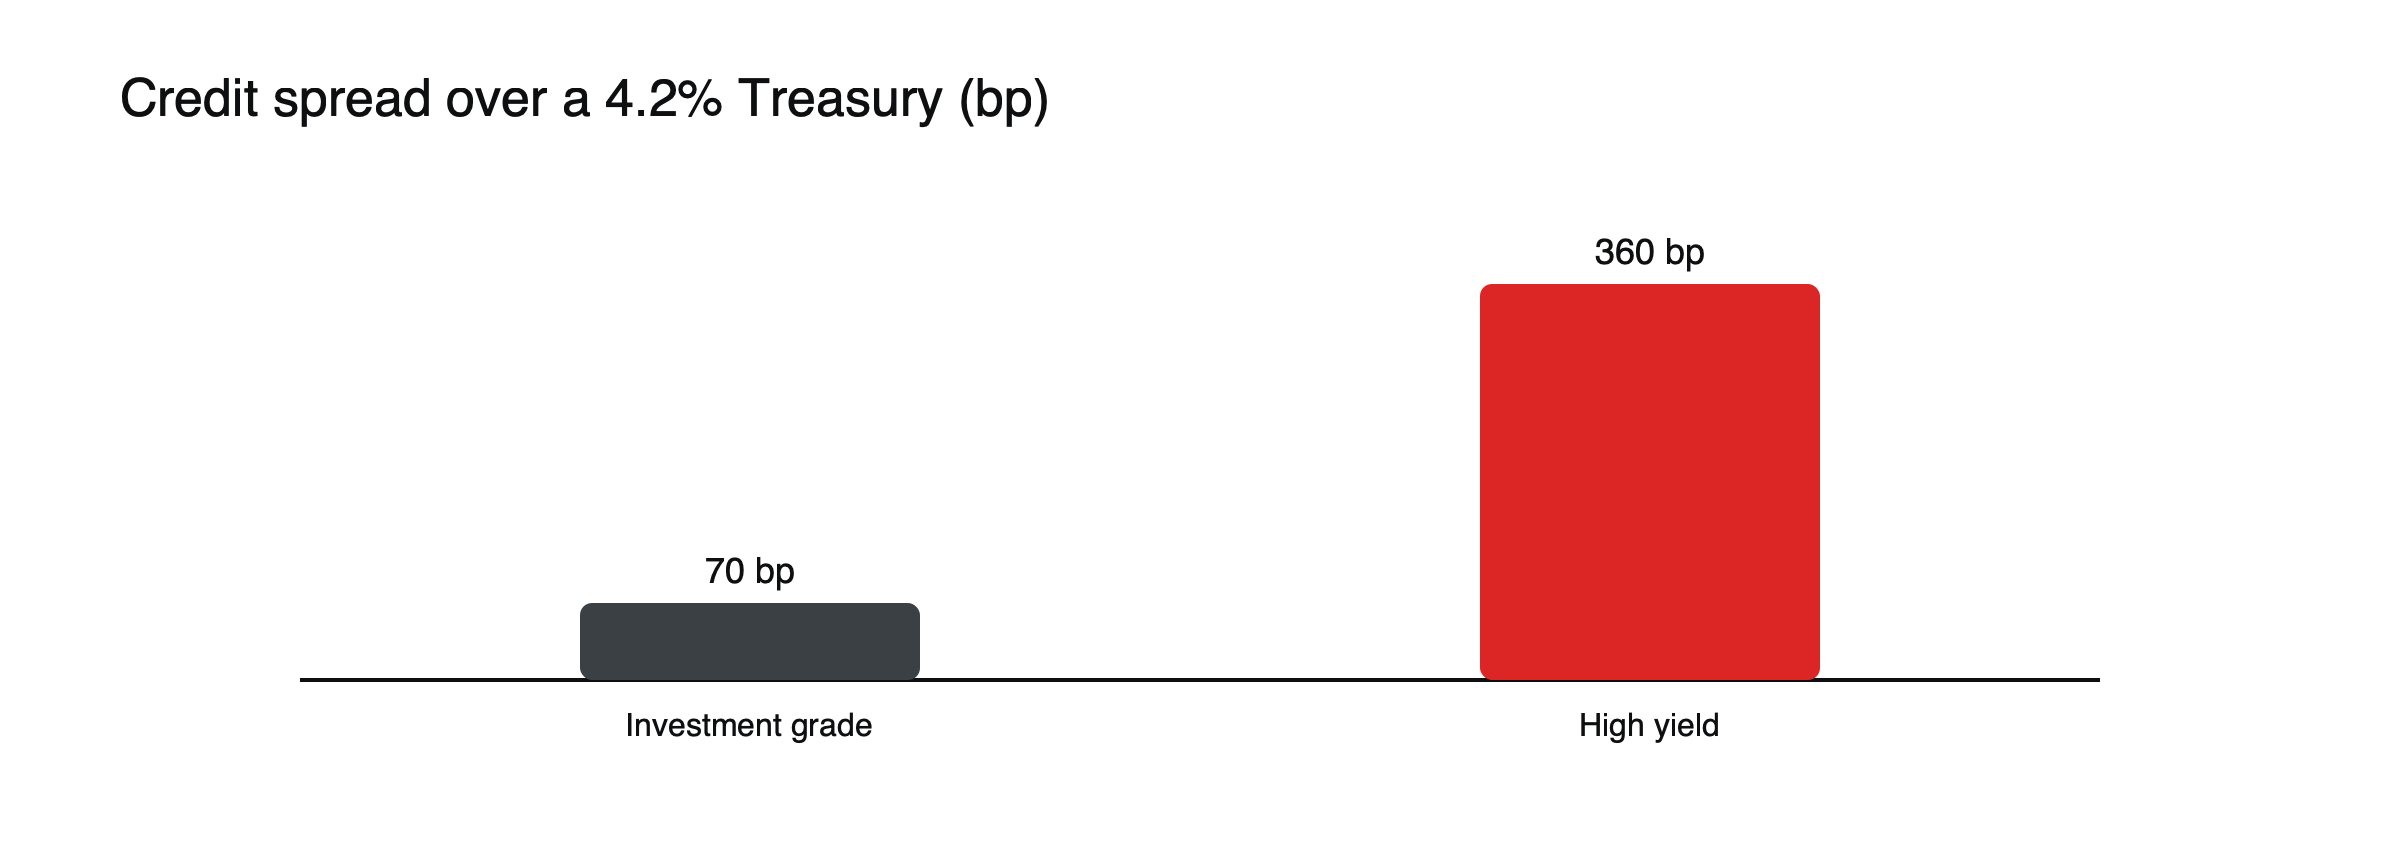
Figure: Spreads over Treasuries (example values).
(Example values.)
From spread to price, worked through
A corporate bond fund with a duration of about 6 holds bonds whose spreads widen by 1 percentage point in a sell-off, while government yields are unchanged. The fund’s price falls about 6%. If government yields fell 0.5 points at the same time, as often happens when investors seek safety, the net fall would be about 3%. (Example values.) Spread changes and government yield changes can offset or reinforce each other.
What drives spreads
Spreads reflect expected default losses, but also liquidity, investors’ appetite for risk and the supply of new bonds. In calm, optimistic markets, spreads can fall below what default rates alone would justify; in panics, they can rise far above, as liquidity dries up and investors demand extra compensation for uncertainty.
What spreads signal
- Widening: rising worry about defaults or recession; often coincides with falling stocks.
- Narrowing: confidence and strong demand for yield.
Recent extremes
US high-yield spreads jumped to about 1,087 basis points on March 23, 2020, as markets priced widespread defaults. They were near multi-year lows, around 270 basis points, in July 2026.
Investment grade and high yield
Investment-grade spreads are typically around one percentage point and move in a narrower range; high-yield spreads are several times wider and swing much more with the economy. Within each group, lower ratings carry wider spreads. Watching both shows whether stress is confined to weaker borrowers or spreading to stronger ones. See investment-grade vs high-yield bonds.
Option-adjusted spreads
Many corporate bonds contain call options or other features. The option-adjusted spread, or OAS, estimates the spread after allowing for those features, giving a cleaner comparison between bonds. Index spreads quoted in the news are usually option-adjusted.
Why traders watch them. Spreads are a real-time gauge of risk appetite, often moving before stocks. Sudden widening from tight levels can be an early warning.
Limits. Tight spreads can persist for years and widen suddenly; they reflect liquidity as well as default risk.
See investment-grade vs high-yield bonds, bond market myths and how bonds work.
Credit default swaps
Credit default swaps, or CDS, are contracts that pay out if a borrower defaults. Their prices, quoted as annual premiums in basis points, offer another view of credit risk, for companies and for governments. CDS prices can move faster than bond spreads in a crisis, making them an early warning signal for some investors.
Spreads and share prices
Spreads and share prices usually move in opposite directions: when spreads widen, shares often fall, because both reflect worries about corporate profits and defaults. Divergences, such as shares rising while spreads widen, can signal that one market is misreading the risks.
Spreads in Europe
European corporate bonds are measured against German Bunds or swap rates, and European spreads respond to the same forces as US spreads, plus euro-area concerns such as stress in a particular government bond market.
Using spreads as a CFD trader
Spreads are not traded directly through most CFD platforms, but they inform trades in index CFDs, high-yield bond ETFs and bank shares. Sharp widening from tight levels has often coincided with falling share indices, making spreads a useful risk dashboard.
Spreads through the cycle, illustrated
Spreads typically follow the economic cycle. Late in an expansion, with profits strong and defaults low, high-yield spreads may sit around 3 percentage points. As a recession approaches and defaults are expected to rise, they can widen to 6 points or more, and in a panic beyond 10, as in March 2020. As the economy recovers and central banks support markets, they narrow again. (Illustrative pattern, with the 2020 peak sourced.) Buying when spreads are wide has often been rewarded, but only for investors able to tolerate the losses that come first.
Spread duration
Spread duration measures how much a bond’s price changes when its spread changes, holding government yields constant. For most ordinary corporate bonds, it is close to the bond’s regular duration, so a bond with a duration of 5 loses about 5% if its spread widens by 1 point. Longer bonds are therefore more exposed to spread changes as well as to rate changes.
The liquidity part of the spread
Part of every corporate spread compensates for the difficulty of selling the bond quickly. Bonds from smaller issuers, or those that trade rarely, carry larger liquidity premiums. In crises, this part of the spread can jump even for companies whose ability to repay has barely changed, which is why spreads sometimes overshoot what default risk alone would justify.
Spreads and central banks
Central banks influence spreads indirectly through interest rates and directly when they buy corporate bonds, as the Federal Reserve announced it would in March 2020. That support helped spreads narrow quickly from their peak, and investors now watch for signs that central banks might intervene again in severe stress.
Common misreadings
- Treating spreads purely as default probabilities.
- Assuming tight spreads will stay tight.
Government bond spreads
The same idea applies to governments. In the euro area, Italian and Spanish government bonds trade at spreads over German Bunds that reflect differences in fiscal strength and political risk. When those spreads widen sharply, as during the 2010 to 2012 debt crisis, European banks and share indices often come under pressure, and the European Central Bank’s response becomes a key market driver.
A spread dashboard
- US investment-grade and high-yield spreads
- European corporate spreads
- Italian–German government bond spread
- Major banks’ credit default swap prices
Checking these weekly gives an early picture of whether credit markets are calm or stressed, often before share prices react.
Spreads and company results
Individual companies’ spreads react to their results, debt plans and ratings changes. A company announcing a large debt-funded acquisition may see its bonds’ spreads widen even as its shares rise, because bondholders bear more risk while shareholders hope for growth.
Reading spread charts
Spread charts are best read against their own history. A high-yield spread of 4 points may be normal in one decade and wide in another, depending on the mix of issuers and economic conditions. Watching the direction and speed of moves, such as a rise of one point in a month from tight levels, often tells more than the level itself. Comparing investment-grade and high-yield spreads on the same chart shows whether stress is spreading from weaker to stronger borrowers.
Spreads and bank lending
Banks’ willingness to lend often moves with credit spreads. When spreads widen sharply, banks typically tighten lending standards, raising borrowing costs for companies and households beyond the bond market. Surveys of bank lending conditions, published by central banks, often confirm what spreads have already signaled, which is why spreads are watched as a leading indicator of the wider economy.
Spreads in a rate shock
When government yields jump because of inflation rather than recession fears, as in 2022, corporate spreads may widen only modestly while bond prices fall mainly because of rising government yields. In a recession scare, the reverse can happen: government yields fall while spreads widen sharply. Separating the two components explains why corporate bond funds sometimes fall when Treasuries rally, and sometimes fall alongside them. Checking which component is moving tells you which risk the market is mainly pricing.
Frequently asked questions
Are tight spreads a warning sign?
They signal confidence, but they also leave little cushion if conditions worsen, so some investors become more cautious when spreads are near historic lows.
What is a basis point?
One hundredth of a percentage point. A spread of 270 basis points equals 2.70 percentage points.
Leverage, margin and cost figures in this article are example values for illustration. Actual terms depend on the provider, the instrument and the rules in your country.
This article is educational content and does not constitute financial, investment, legal or tax advice. Digital assets are volatile and you may lose the amount you invest.