
What Caused the 2010 Flash Crash?
On May 6, 2010, the Dow fell nearly 1,000 points in under half an hour, then recovered. Regulators traced it to a $4.1 billion automated futures sale.
The 2010 flash crash came on May 6, 2010, when the Dow fell nearly 1,000 points in under half an hour, then recovered most of the drop within minutes. A joint SEC and CFTC report traced it to an automated sale of 75,000 E-mini futures, worth about $4.1 billion, in a stressed market as liquidity providers pulled back.
Timeline
- Morning: markets are nervous about the European debt crisis; the Dow is down about 2.5% by early afternoon.
- 2:32 p.m.: the sell program starts, targeting a share of trading volume regardless of price.
- Minutes later: futures and stocks plunge; high-frequency traders trade among themselves, then withdraw.
- Around 2:45 p.m.: the slide stops after an automatic pause in futures trading; prices rebound.
- Weeks after: about 21,000 trades executed at absurd prices are canceled.
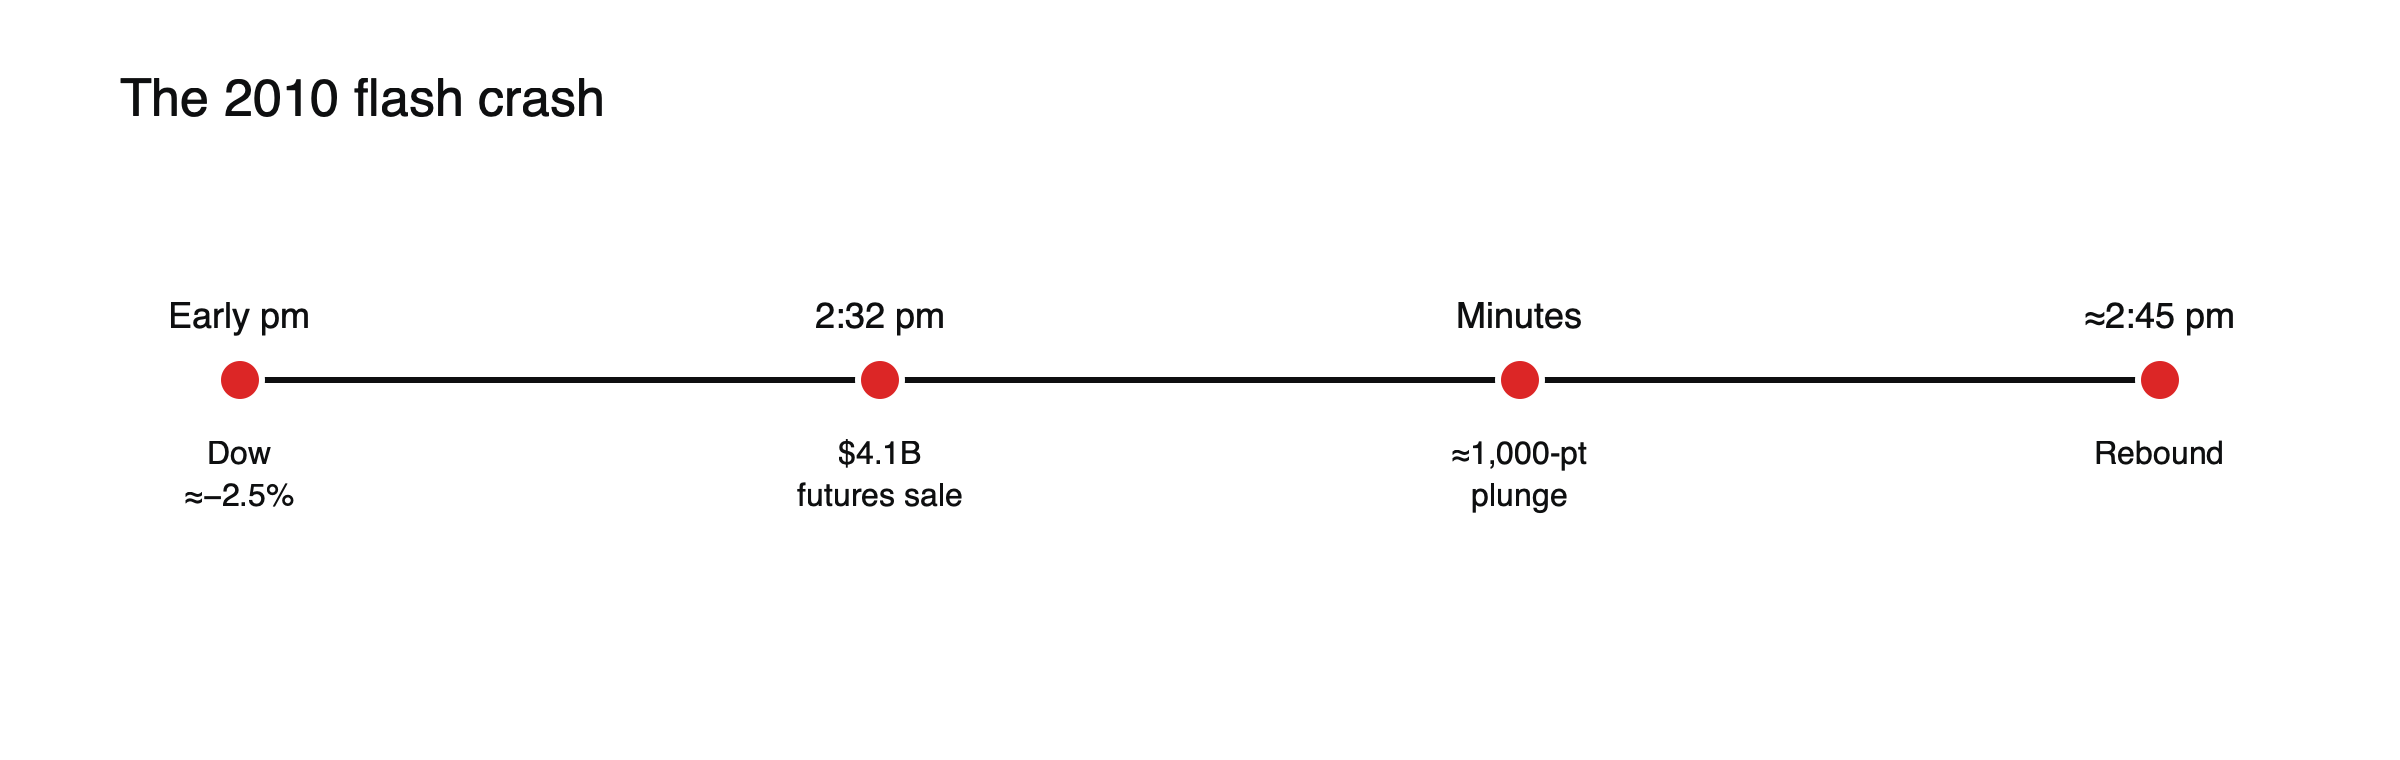
Figure: Thirty minutes on May 6, 2010.
The sell order in detail
The joint report described a large fundamental trader, widely reported to be a mutual fund company, using an automated algorithm to sell 75,000 E-mini S&P 500 contracts as a hedge. The algorithm was set to sell at a pace equal to about 9% of the previous minute’s trading volume, with no regard to price or time. As prices fell and volume surged, the algorithm sold faster, completing the sale in about 20 minutes rather than the hours a trade of that size might normally take.
Hot potato trading
High-frequency traders initially bought many of the contracts, then quickly sold them on, often to each other, as they tried to reduce their positions. This passing back and forth, which the report likened to a hot potato, inflated trading volume without adding real buying interest. The rising volume caused the selling algorithm to accelerate, deepening the fall.
Why it happened
- An order with no price limit in a falling market.
- Liquidity withdrawal: market makers stepped back as volatility spiked.
- Fragmented markets without coordinated pauses at the time.
Stub quotes and absurd prices
As liquidity vanished in individual shares, orders were filled against stub quotes, placeholder prices that market makers posted far from the market with no expectation of trading. Some well-known shares traded for a penny, while others traded at $100,000. Investors whose stop orders turned into market orders at those moments were filled at prices that had nothing to do with the companies’ value.
Canceled trades
Exchanges canceled about 21,000 trades executed at prices far from normal, but trades at less extreme prices stood, leaving some investors with losses.
Single-stock pauses
Regulators introduced circuit breakers that paused an S&P 500 stock moving 10% or more in five minutes, later replaced by limit-up/limit-down price bands.
Market-wide breakers revised
Market-wide circuit breakers were also overhauled. See how stock market circuit breakers work.
A trader charged years later
In 2015, US authorities charged a London-based trader, Navinder Sarao, with manipulating E-mini futures through spoofing, placing large orders he did not intend to execute to move prices, including on the day of the flash crash. He later pleaded guilty to related charges. His activity was cited as one of the conditions that contributed to the market’s fragility that day, though the main trigger remained the large sell order.
Later flash events
Flash crashes did not end in 2010. On August 24, 2015, many US shares and funds opened at extreme prices and were repeatedly halted; in October 2014, US Treasury yields swung wildly within minutes; in October 2016, the pound fell sharply in thin Asian trading. Each episode showed how quickly liquidity can disappear in electronic markets. See what caused the 2016 pound flash crash.
Lessons
Electronic markets can lose liquidity in seconds; stop orders can fill at extreme prices. See how stop-loss orders work, what happened on Black Monday 1987 and what moves stock market indices.
Timeline at a glance
| Time (New York), May 6, 2010 | Event |
|---|---|
| Morning to early afternoon | Markets nervous about Europe; Dow down about 2.5% |
| 2:32 p.m. | Automated sell program begins |
| About 2:41–2:45 p.m. | Steepest fall; liquidity vanishes |
| About 2:45 p.m. | Futures pause for five seconds; selling slows |
| By about 3:00 p.m. | Prices recover most of the drop |
Why liquidity disappeared
Market makers and high-frequency traders are not obliged to keep trading in every condition. As prices moved violently and data feeds lagged, many paused their systems to avoid losses or errors. With them gone, the order book thinned to the point where even modest orders moved prices dramatically. Liquidity that looks deep in normal times can be fragile under stress.
Lessons for CFD traders
Index and share CFDs priced from these markets would have shown the same extreme moves. Stop orders could have been filled at prices far from their levels, and positions closed at the bottom could not benefit from the rebound minutes later. Avoiding market orders in fast markets, using guaranteed stops where available and keeping leverage modest are the main defenses. See how stop-loss orders work.
Rule changes in detail
After the flash crash, regulators introduced several reforms. Limit up-limit down bands now prevent trades in individual shares outside set ranges around recent prices, pausing trading if prices hit the bands. Stub quotes far from the market were effectively banned, as market makers had to quote within a reasonable distance of current prices. Rules on canceling clearly erroneous trades were made more predictable. Together, these measures aim to prevent individual shares from trading at absurd prices.
The high-frequency trading debate
The flash crash intensified debate about high-frequency trading. Critics argued that firms providing liquidity in calm markets disappear when it is needed most, and that their speed can amplify instability. Supporters replied that they narrow spreads and lower costs for ordinary investors most of the time, and that the crash was triggered by a large, poorly executed order rather than by high-frequency trading itself.
Market structure today
US share trading remains spread across many exchanges and alternative venues, linked by high-speed connections and governed by rules that require orders to be sent to the best available price. The fragmentation that contributed to the confusion in 2010 still exists, but coordinated safeguards now apply across venues.
Common misreadings
- Assuming a market that recovers quickly caused no losses.
- Treating stop orders as guaranteed exits.
A trader’s view, illustrated
Suppose a trader held shares of a well-known company trading at $40, with a stop order at $37. (Illustrative scenario.) In the space of a few minutes on May 6, the shares fell through $37, the stop became a market order and it was filled at $8 against a nearly empty order book. Fifteen minutes later, the shares were back near $40. Because the fill was not extreme enough to be canceled under the rules then in force, the trader’s loss stood, far larger than the $3 per share they had planned to risk.
The pause that stopped the fall
The decline in E-mini futures ended when the exchange’s automatic protection paused trading for five seconds after a run of sharply falling prices. That brief pause allowed buyers to return and order books to refill, and prices began to recover almost immediately. The episode showed how a very short interruption can break a self-reinforcing cascade.
Why it matters for index CFDs
Index CFDs priced from futures would have shown the same plunge and rebound. A long position with a tight stop could have been closed near the low, while one without a stop might have been closed by a margin call before prices recovered. Either way, minutes of extreme illiquidity could turn a small planned risk into a large realized loss. Guaranteed stops, where offered, prevent this, for a fee.
Frequently asked questions
Did the flash crash cause lasting damage?
Prices recovered within minutes and the economy was unaffected, but confidence in market structure was shaken, leading to new rules.
Could it happen again?
Price bands and circuit breakers now limit extreme moves in individual shares, but brief liquidity gaps still occur in electronic markets.
This article is educational content and does not constitute financial, investment, legal or tax advice. Digital assets are volatile and you may lose the amount you invest.
Sources
- Regulators release flash crash probe report ($4.1 billion sell program; 75,000 contracts in 20 minutes; Dow down about 2.5% before; nearly 21,000 trades canceled; 10% in five minutes rule) — PlanAdviser / AP
- ‘Flash crash’ report: a tale of how not to make a big trade (order placed at 2:32 p.m.) — Christian Science Monitor
- Lessons from Black Monday (2010: Dow fell about 1,000 points in minutes, recovered most) — The Globe and Mail