
Common Mistakes When Trading Index CFDs
Grading an index CFD trade plan on six points: position value, the open, holding costs, concentration, leverage and correlated indices, with fixes.
Common index CFD mistakes: picking a value per point without checking position value, trading the open without a plan, forgetting financing and dividend adjustments, assuming diversification when a few stocks dominate, using too much leverage and holding indices that move together. Grading one real-looking trade plan against these six points shows how they combine.
The plan under review
Here is a plan a trader might write for a three-week trade. (Hypothetical account and figures.)
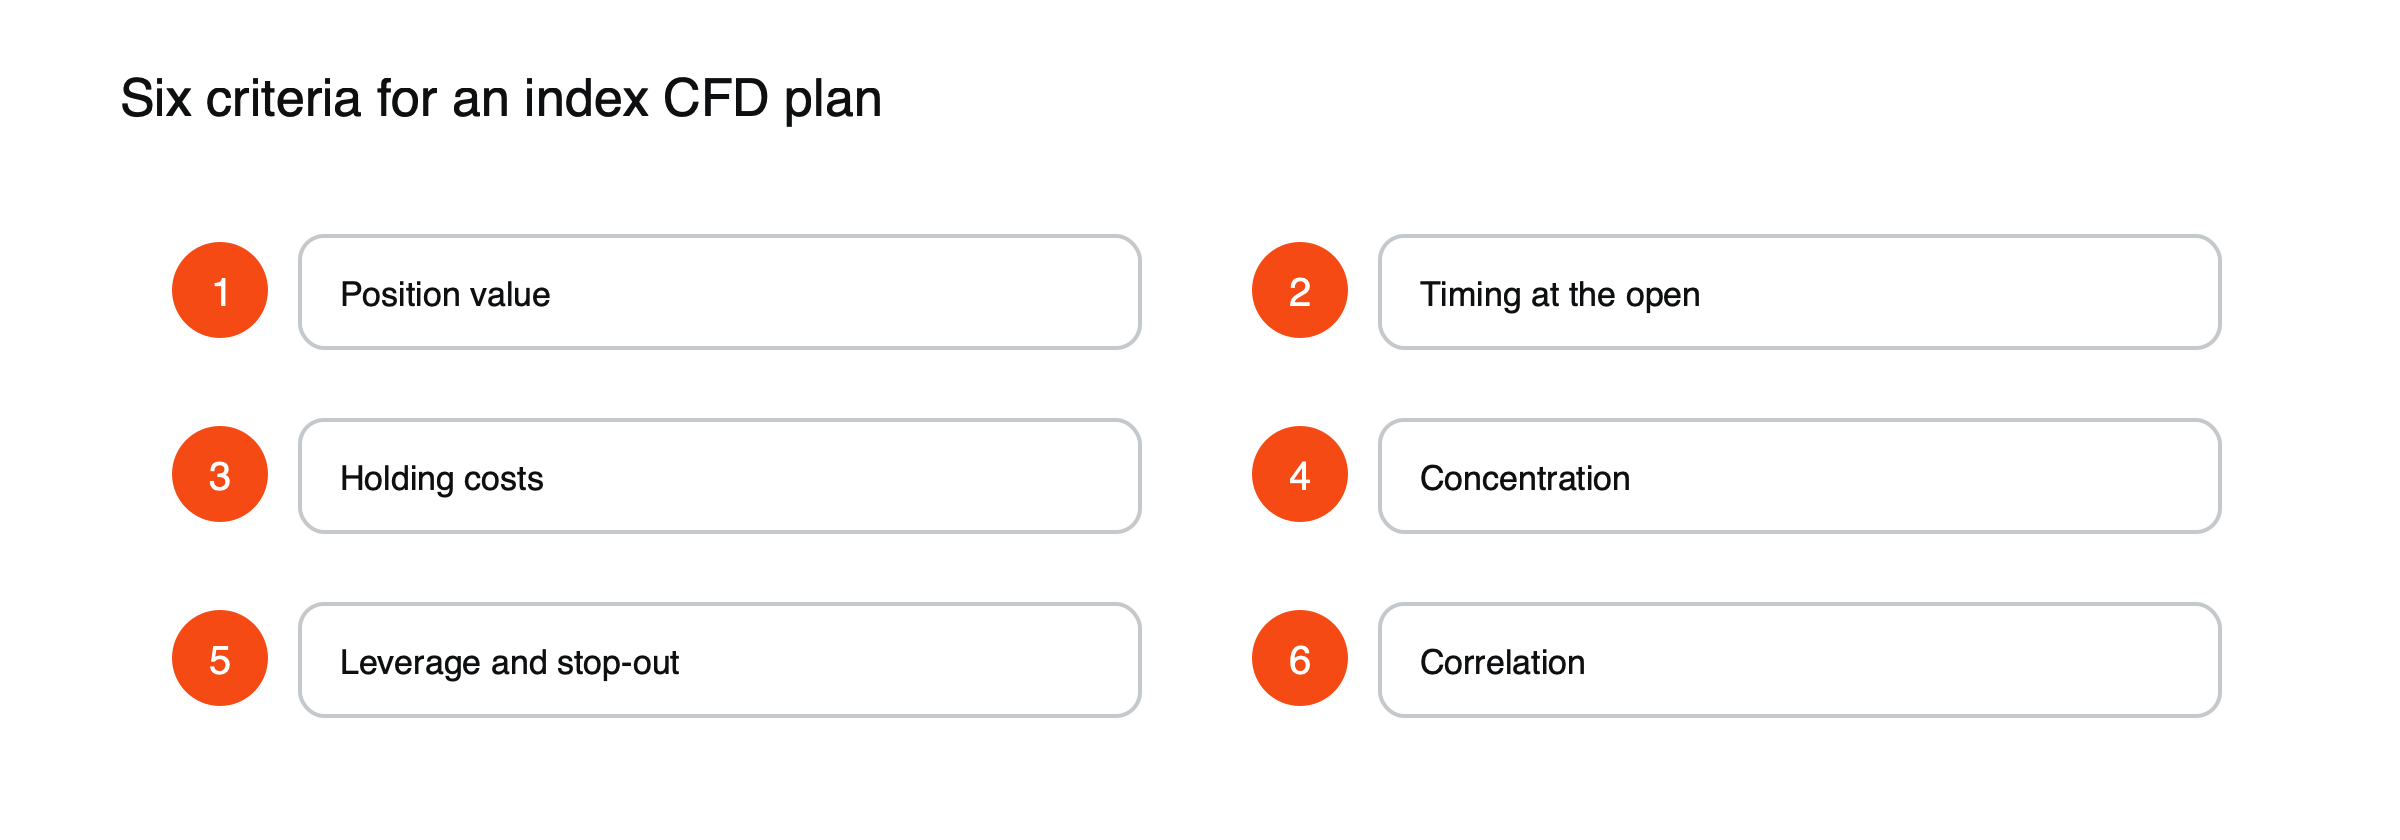
Figure: Six criteria for an index CFD plan.
Account: $10,000. Idea: US shares will rise after strong technology earnings. Trade 1: buy US 500 at the 9:30 a.m. open at 5,000, $10 per point, stop 15 points below entry. Trade 2: buy US Tech 100 at 21,000, $5 per point, same morning. Holding period: about three weeks. Exit: when the trend ends.
Each section below grades one part of the plan from 0 (missing or wrong) to 2 (sound), explains the grade and shows the fix. A total of 12 would be a fully sound plan.
Criterion 1: position value — grade 0
The plan chooses $10 per point without stating what that means in money. At 5,000, it is a $50,000 position; the US Tech 100 trade adds $105,000. Together, $155,000 of exposure sits on a $10,000 account, 15.5 times its size. The point values look small; the positions are not.
Fix: convert every point value into position value before trading, and decide on a maximum total exposure relative to the account. See how to calculate the value of a point on an index CFD.
Criterion 2: timing at the open — grade 0
Entering at the first tick of the cash open with a 15-point stop invites an exit on noise. The first minutes bring the widest spreads and sharpest swings of the day; a US index can easily move 30 points or more in the opening range. The stop is likely to be hit before the idea has been tested.
Fix: let an opening range form, then place stops outside it and size the position to the wider distance. See how to plan index trades around market opens.
Criterion 3: holding costs — grade 0
The plan says nothing about financing. On $155,000 of cash index exposure at an illustrative 6.8% a year, three weeks cost about $606, 6% of the account, before any price move. Dividend adjustments will offset only a small part.
Fix: estimate financing and dividend adjustments for the planned holding period, or consider futures-based CFDs for longer holds. See how index dividends are adjusted and index futures vs index CFDs.
Criterion 4: concentration — grade 1
The idea, strong technology earnings, is at least explicit about what drives the trade, which earns a point. But the plan does not check which companies report when, or how much they weigh. The S&P 500’s top ten members reached a record 40.7% of the index in 2025, so a single disappointing report from one of them can wipe out the trade.
Fix: list the reporting dates of the largest members during the holding period and decide in advance whether to hold through them. See why a handful of stocks can drive an entire index.
Criterion 5: leverage and stop-out — grade 0
Total margin at the 20:1 retail limit is about $7,750. With the account at $10,000, positions are closed when equity falls to half the margin, about $3,875, so a loss of about $6,125 triggers a stop-out. Across $155,000 of exposure, that is a fall of only about 4%, a move indices make in a bad week.
Fix: size from the loss you accept, not from the margin available. See what margin calls and stop-outs are.
Criterion 6: correlation — grade 0
The two trades are presented as separate ideas, but the S&P 500 and Nasdaq 100 moved with a correlation of about 0.98 in March 2026. A 4% fall in both costs about $6,200, the same as one oversized position. The plan has one bet, not two.
Fix: add exposures in highly correlated indices together and size the total. See S&P 500 vs Nasdaq 100.
The scorecard
| Criterion | Grade |
|---|---|
| Position value | 0 |
| Timing at the open | 0 |
| Holding costs | 0 |
| Concentration | 1 |
| Leverage and stop-out | 0 |
| Correlation | 0 |
| Total | 1 of 12 |
The revised plan
Trade: buy US 500 only, after the first 30 minutes, at $2 per point, a $10,000 position, equal to the account. Stop: 60 points below entry, outside the opening range, risking $120, or 1.2% of the account. Costs: about $39 of financing over three weeks. Concentration: the two largest members report in week two; reduce to $1 per point the day before. Exit: review after the earnings week; close if the index closes below the stop level or the earnings thesis fails.
The revised plan scores 2 on every criterion. It is smaller and less exciting, but a bad week now costs a few percent of the account rather than ending the trade by stop-out.
See how stock index CFDs work.
How the original plan could have played out
Suppose that in week two, one of the largest US technology companies reports disappointing results, and over three days the S&P 500 falls 4% and the Nasdaq 100 a little more. (Illustrative scenario.) The original plan’s combined exposure of $155,000 loses about $6,200, enough to trigger a stop-out with the account down more than 60%. The revised plan’s $10,000 position loses about $200 on the same move, but its 60-point stop closes it earlier, for a loss of about $120, 1.2% of the account. The same market move ends one plan and barely dents the other.
Objections to the revised plan
“It is too small to be worth it.” A 100-point rise earns $200, 2% of the account, which compounds over many trades without risking ruin on one. “The stop is too far.” It sits outside normal opening swings, so it is hit only if the idea is wrong, not because of noise. “Waiting 30 minutes misses the move.” Sometimes it does, but the cost of a few missed points is smaller than repeatedly being stopped out at the open.
Building your own scorecard
The six criteria above work for almost any index trade. Writing the plan down and grading it before entering, honestly, takes a few minutes. Any criterion scored 0 is a reason to change the plan or skip the trade. Over time, reviewing scores alongside results shows which weaknesses cost the most.
What else a scorecard can catch
Other common weaknesses include holding through major data releases at full size, ignoring the currency of non-dollar indices, trading thin overnight sessions with tight stops and forgetting about dividend-heavy days. Adding them as extra criteria tailors the scorecard to the indices you trade.
Frequently asked questions
What is the single most common index CFD mistake?
Taking on far more exposure than intended by choosing a value per point without converting it into position value.
Is it safer to trade one index or several?
Several indices only reduce risk if they are not highly correlated. Positions in the S&P 500 and Nasdaq 100 behave almost like one larger position.
Grading after the trade
The scorecard is also useful after a trade closes. Re-grading the plan with hindsight, and comparing it with what actually happened, shows whether losses came from bad luck or from weaknesses the scorecard could have caught. Trades that scored well but lost are part of normal trading; trades that scored poorly and lost point to habits worth changing. Keeping these reviews in a journal turns individual trades into lessons that improve future plans. Even a single honest written review each month makes the next plan noticeably stronger and safer than before.
This article is educational content and does not constitute financial, investment, legal or tax advice. Digital assets are volatile and you may lose the amount you invest.