
How to Read a Balance Sheet
Check that assets equal liabilities plus equity, compare current assets with current liabilities, weigh debt against equity and cash: a step-by-step guide.
To read a balance sheet, start with the basic equation, assets equal liabilities plus shareholders’ equity, then check short-term liquidity by comparing current assets with current liabilities, assess debt against equity and cash, and compare with the previous period. The balance sheet is a snapshot of what a company owns and owes on one date.
Before you start
Have the latest and prior balance sheets together; changes tell you more than one snapshot.
Reading it, step by step
Confirm the equation
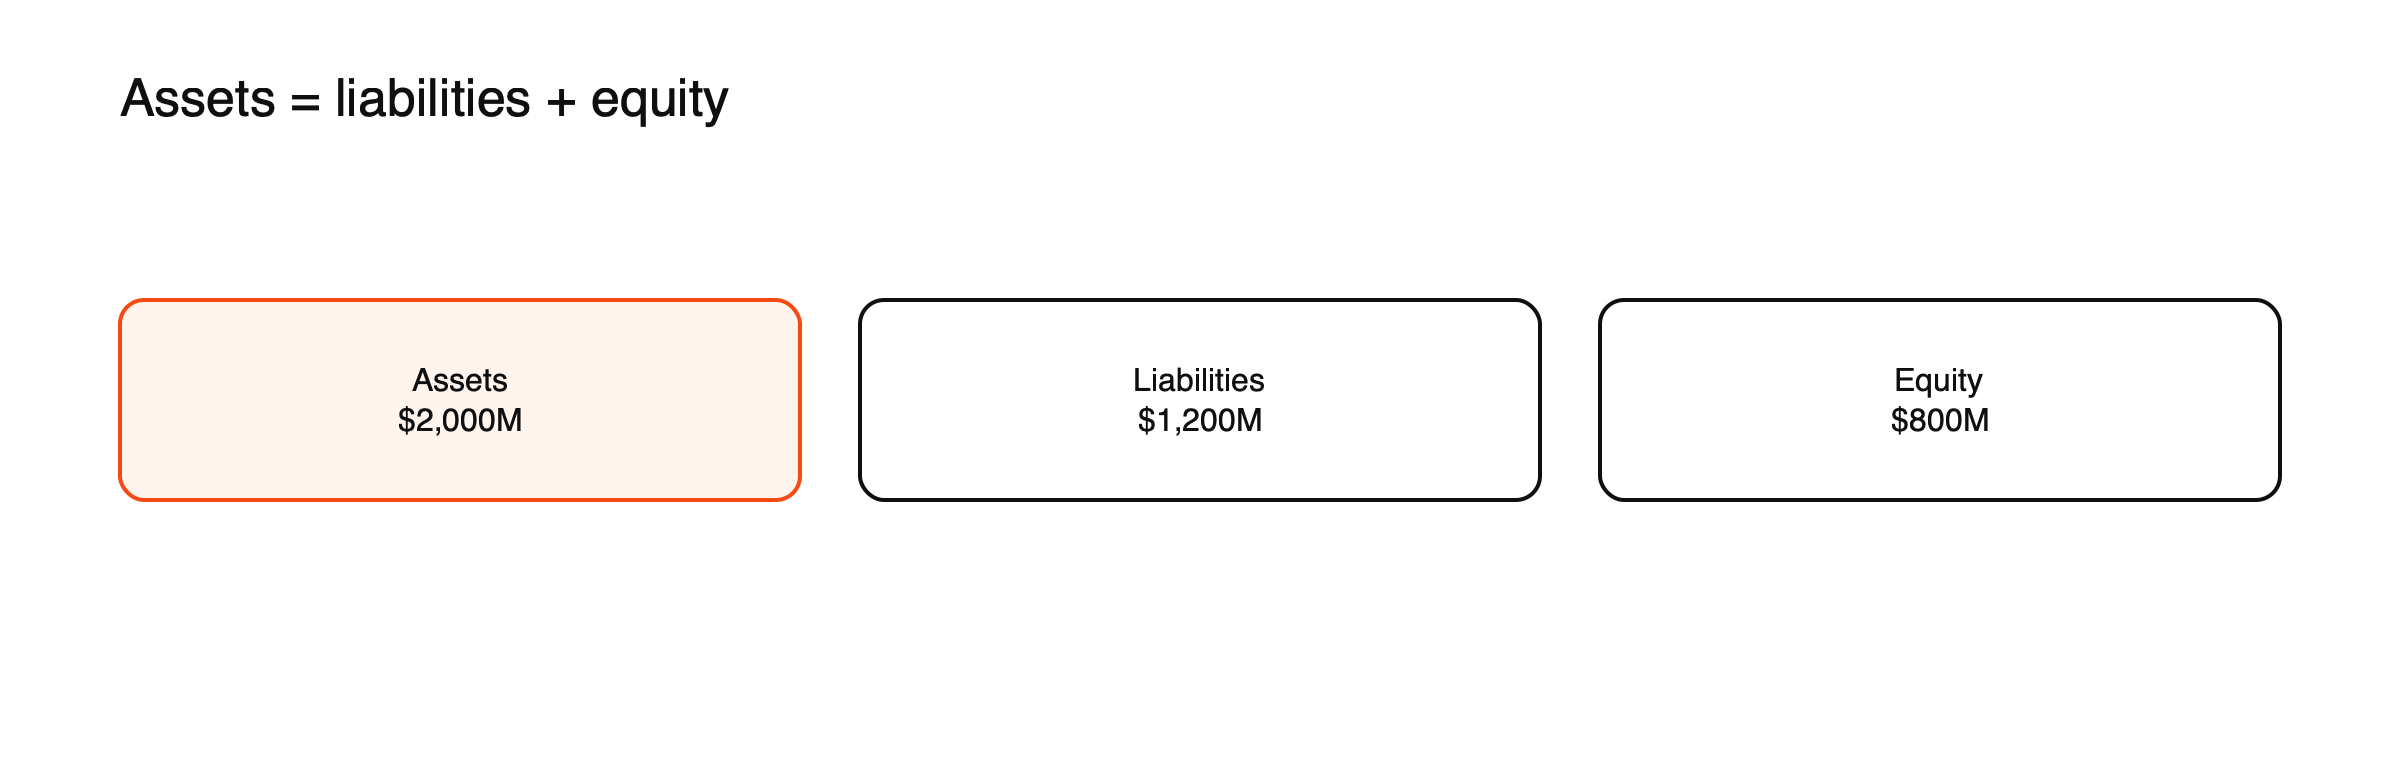
Figure: The balance sheet must balance (hypothetical example).
Assets = liabilities + shareholders’ equity. ExampleCo: $2,000 million of assets = $1,200 million of liabilities + $800 million of equity.
Check liquidity
Current ratio = current assets ÷ current liabilities. ExampleCo: 500 ÷ 400 = 1.25, meaning it has more short-term assets than short-term obligations.
Assess debt
Debt-to-equity = debt ÷ equity. ExampleCo: 400 ÷ 800 = 0.5. Compare with peers; acceptable levels vary by industry.
Look at cash
Cash of $150 million against debt of $400 million gives net debt of $250 million, used in enterprise value. See what EV/EBITDA is.
Note intangible assets
Goodwill from acquisitions can be large and may be written down later.
ExampleCo’s balance sheet
| Assets | $ million | Liabilities and equity | $ million |
|---|---|---|---|
| Cash | 150 | Accounts payable | 250 |
| Receivables | 200 | Short-term debt | 50 |
| Inventory | 150 | Other current liabilities | 100 |
| Current assets | 500 | Current liabilities | 400 |
| Property, plant and equipment | 900 | Long-term debt | 350 |
| Goodwill and intangibles | 450 | Other long-term liabilities | 450 |
| Other long-term assets | 150 | Total liabilities | 1,200 |
| Shareholders’ equity | 800 | ||
| Total assets | 2,000 | Total liabilities and equity | 2,000 |
(Hypothetical company.)
More ratios from the same figures
- Quick ratio = (current assets − inventory) ÷ current liabilities = 350 ÷ 400 = 0.875, a stricter test of liquidity that excludes stock that may be slow to sell.
- Net debt to EBITDA = 250 ÷ 200 = 1.25, showing how many years of operating earnings would repay net debt.
- Return on equity = net income ÷ equity = 97.5 ÷ 800 = about 12.2%, how much profit the company earns on shareholders’ capital.
Each ratio is a starting point for questions, not an answer on its own.
Common mistakes
Ignoring off-balance-sheet obligations described in notes, and judging debt without considering cash flow. See how to read a cash flow statement, how to read an income statement and what moves stock prices.
Working capital
Receivables, inventory and payables together make up working capital, the money tied up in running the business day to day. If receivables or inventory grow much faster than sales, customers may be paying more slowly or products may not be selling, which ties up cash. Changes in working capital explain many differences between profit and operating cash flow. See how to read a cash flow statement.
Goodwill and write-downs
Goodwill arises when a company buys another for more than the fair value of its identifiable assets. ExampleCo’s $450 million of goodwill and intangibles is more than half its equity. If an acquisition performs badly, the company may write down goodwill, reducing assets and equity and producing a large loss on the income statement, though no cash leaves the business at that point. Large goodwill balances deserve attention for that reason.
Book value and the share price
Shareholders’ equity is also called book value. Dividing the share price by book value per share gives the price-to-book ratio. ExampleCo’s market value of $1,950 million against book value of $800 million gives a price-to-book of about 2.4. For banks and asset-heavy businesses, price-to-book is a common valuation measure; for technology companies whose main assets are people and ideas, it says much less.
Leases and other obligations
Since 2019, accounting rules in most major markets have required companies to show most leases on the balance sheet, as an asset representing the right to use the property and a matching liability. This made retailers, airlines and other companies with many leased sites look more indebted on paper, but more accurately so. Other obligations, such as pension deficits, guarantees and purchase commitments, may appear in the notes rather than in the main figures, and can be significant.
A downturn test, illustrated
ExampleCo’s net debt of $250 million is a comfortable 1.25 times its EBITDA of $200 million. If a recession halved EBITDA to $100 million, the same debt would be 2.5 times earnings, still manageable for many businesses but a level at which lenders and investors start paying closer attention. Running this kind of simple stress test on the balance sheet shows how much room a company has before debt becomes a problem. (Hypothetical figures.)
Comparing across industries
What counts as a strong balance sheet depends on the business. Utilities and property companies carry high debt against stable, predictable cash flows. Technology companies often hold large net cash positions. Banks are different altogether, with balance sheets dominated by loans and deposits and judged by capital ratios. Comparing a company with peers in the same industry is more useful than applying one rule to all.
How traders use it
Balance sheet strength matters most when conditions turn. In sell-offs and recessions, companies with high debt and weak liquidity tend to fall furthest, while those with net cash hold up better. Checking a company’s debt and liquidity before holding its shares through uncertain periods is a quick way to judge downside risk.
What equity contains
Shareholders’ equity is made up mainly of the capital shareholders originally paid in and the profits the company has kept over the years, known as retained earnings. Dividends and buybacks reduce equity, while profits add to it. Some companies that buy back large amounts of shares end up with very low or even negative equity, which can make ratios such as return on equity and debt-to-equity look extreme without necessarily signaling distress.
Comparing two balance sheets
A single balance sheet is a snapshot; the changes between two show what happened in between. Rising debt with falling cash suggests the company is borrowing to fund spending or payouts. Growing receivables faster than sales may indicate collection problems. A jump in goodwill points to an acquisition. Reading the changes alongside the cash flow statement explains most of them.
Receivables and inventory in days
Converting working capital into days makes trends easier to spot. ExampleCo’s receivables of $200 million against $1,000 million of annual revenue equal about 73 days of sales; its inventory of $150 million against $600 million of cost of goods sold equals about 91 days. Rising day counts can signal slower collections or unsold stock. (Hypothetical figures.) Comparing day counts with previous years and with competitors shows whether working capital is managed well.
Frequently asked questions
What is a healthy current ratio?
It varies by industry. A ratio above 1 means current assets exceed current liabilities, but some businesses with fast-moving inventory operate comfortably below 1.
Why does the balance sheet always balance?
Because everything a company owns is financed either by borrowing or by its owners, so assets always equal liabilities plus equity.
Company figures in this article are a hypothetical example (“ExampleCo”) for illustration.
This article is educational content and does not constitute financial, investment, legal or tax advice. Digital assets are volatile and you may lose the amount you invest.